

Question: . Consider the financial statement data and stock price data for Mydeco Corp. 1 Click the icon to view the financial statement and stock price
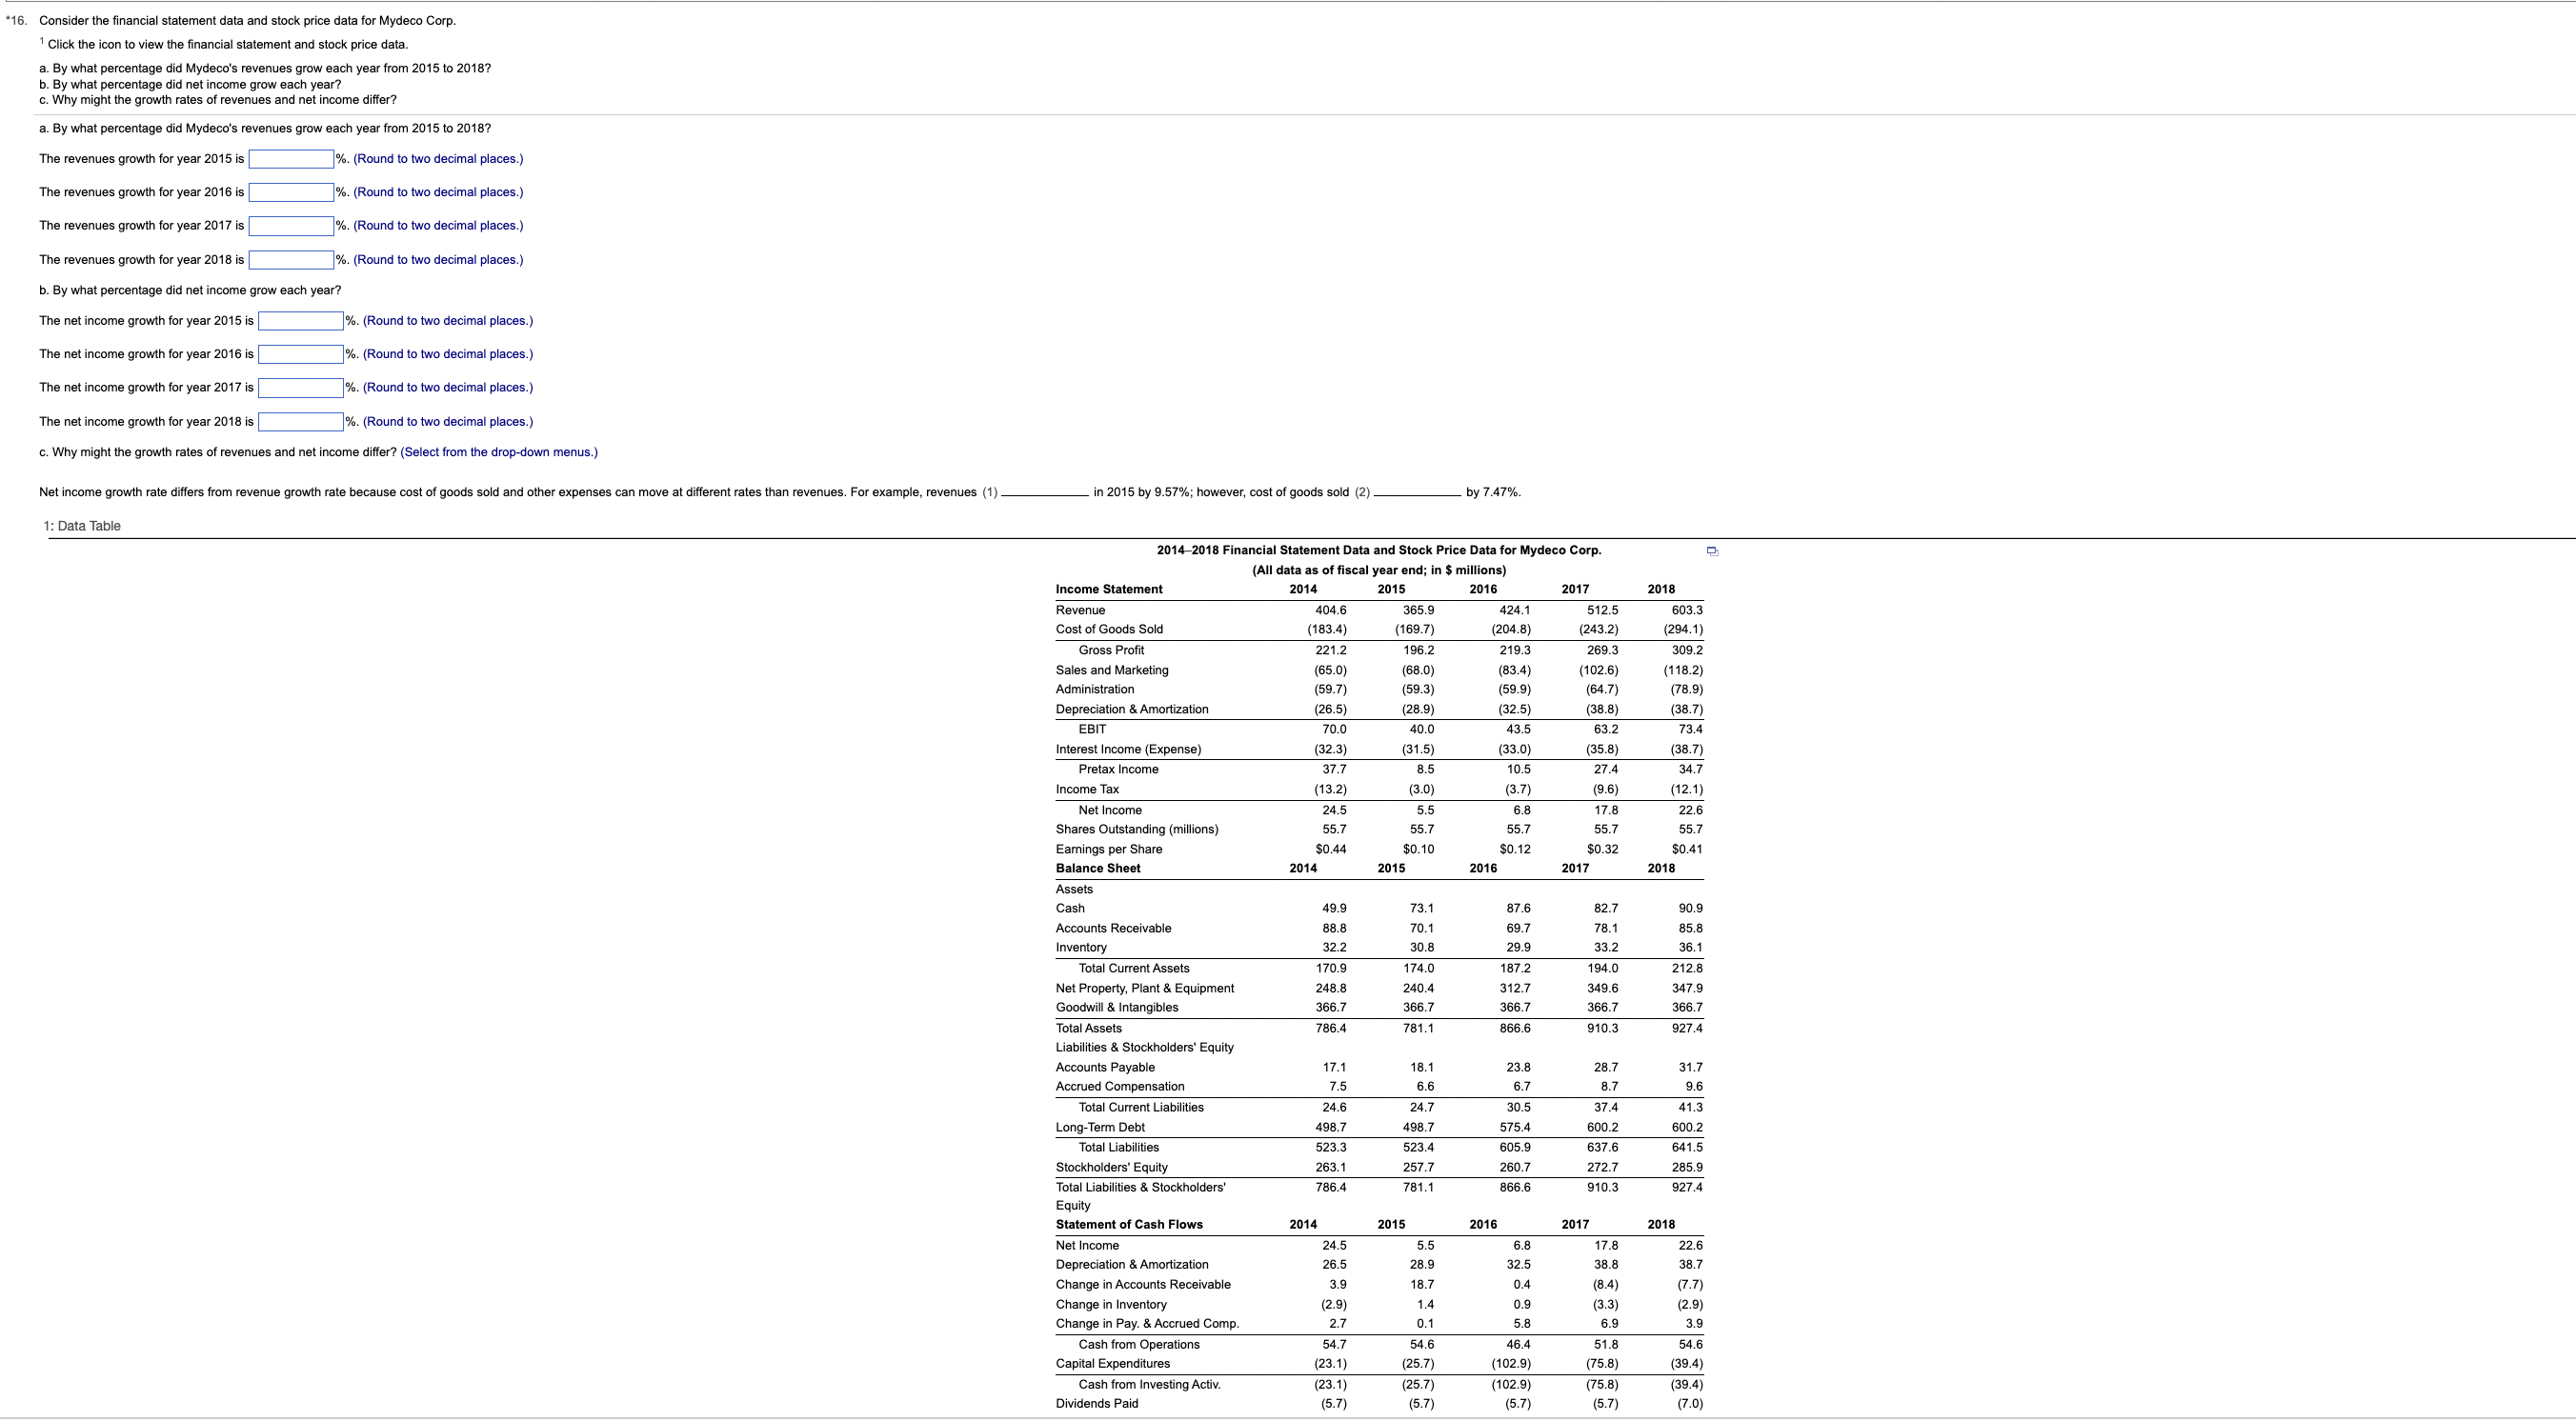
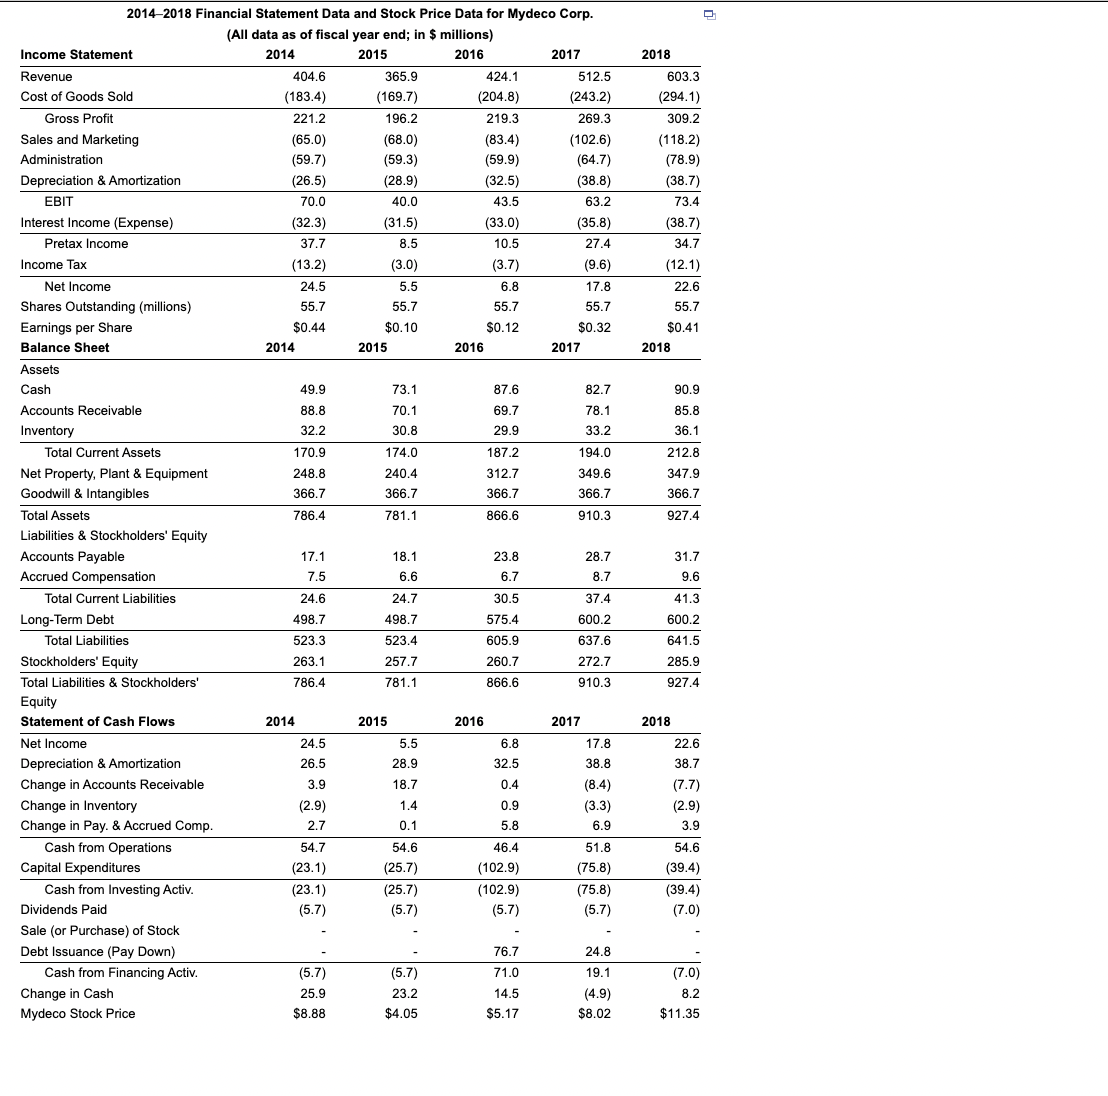
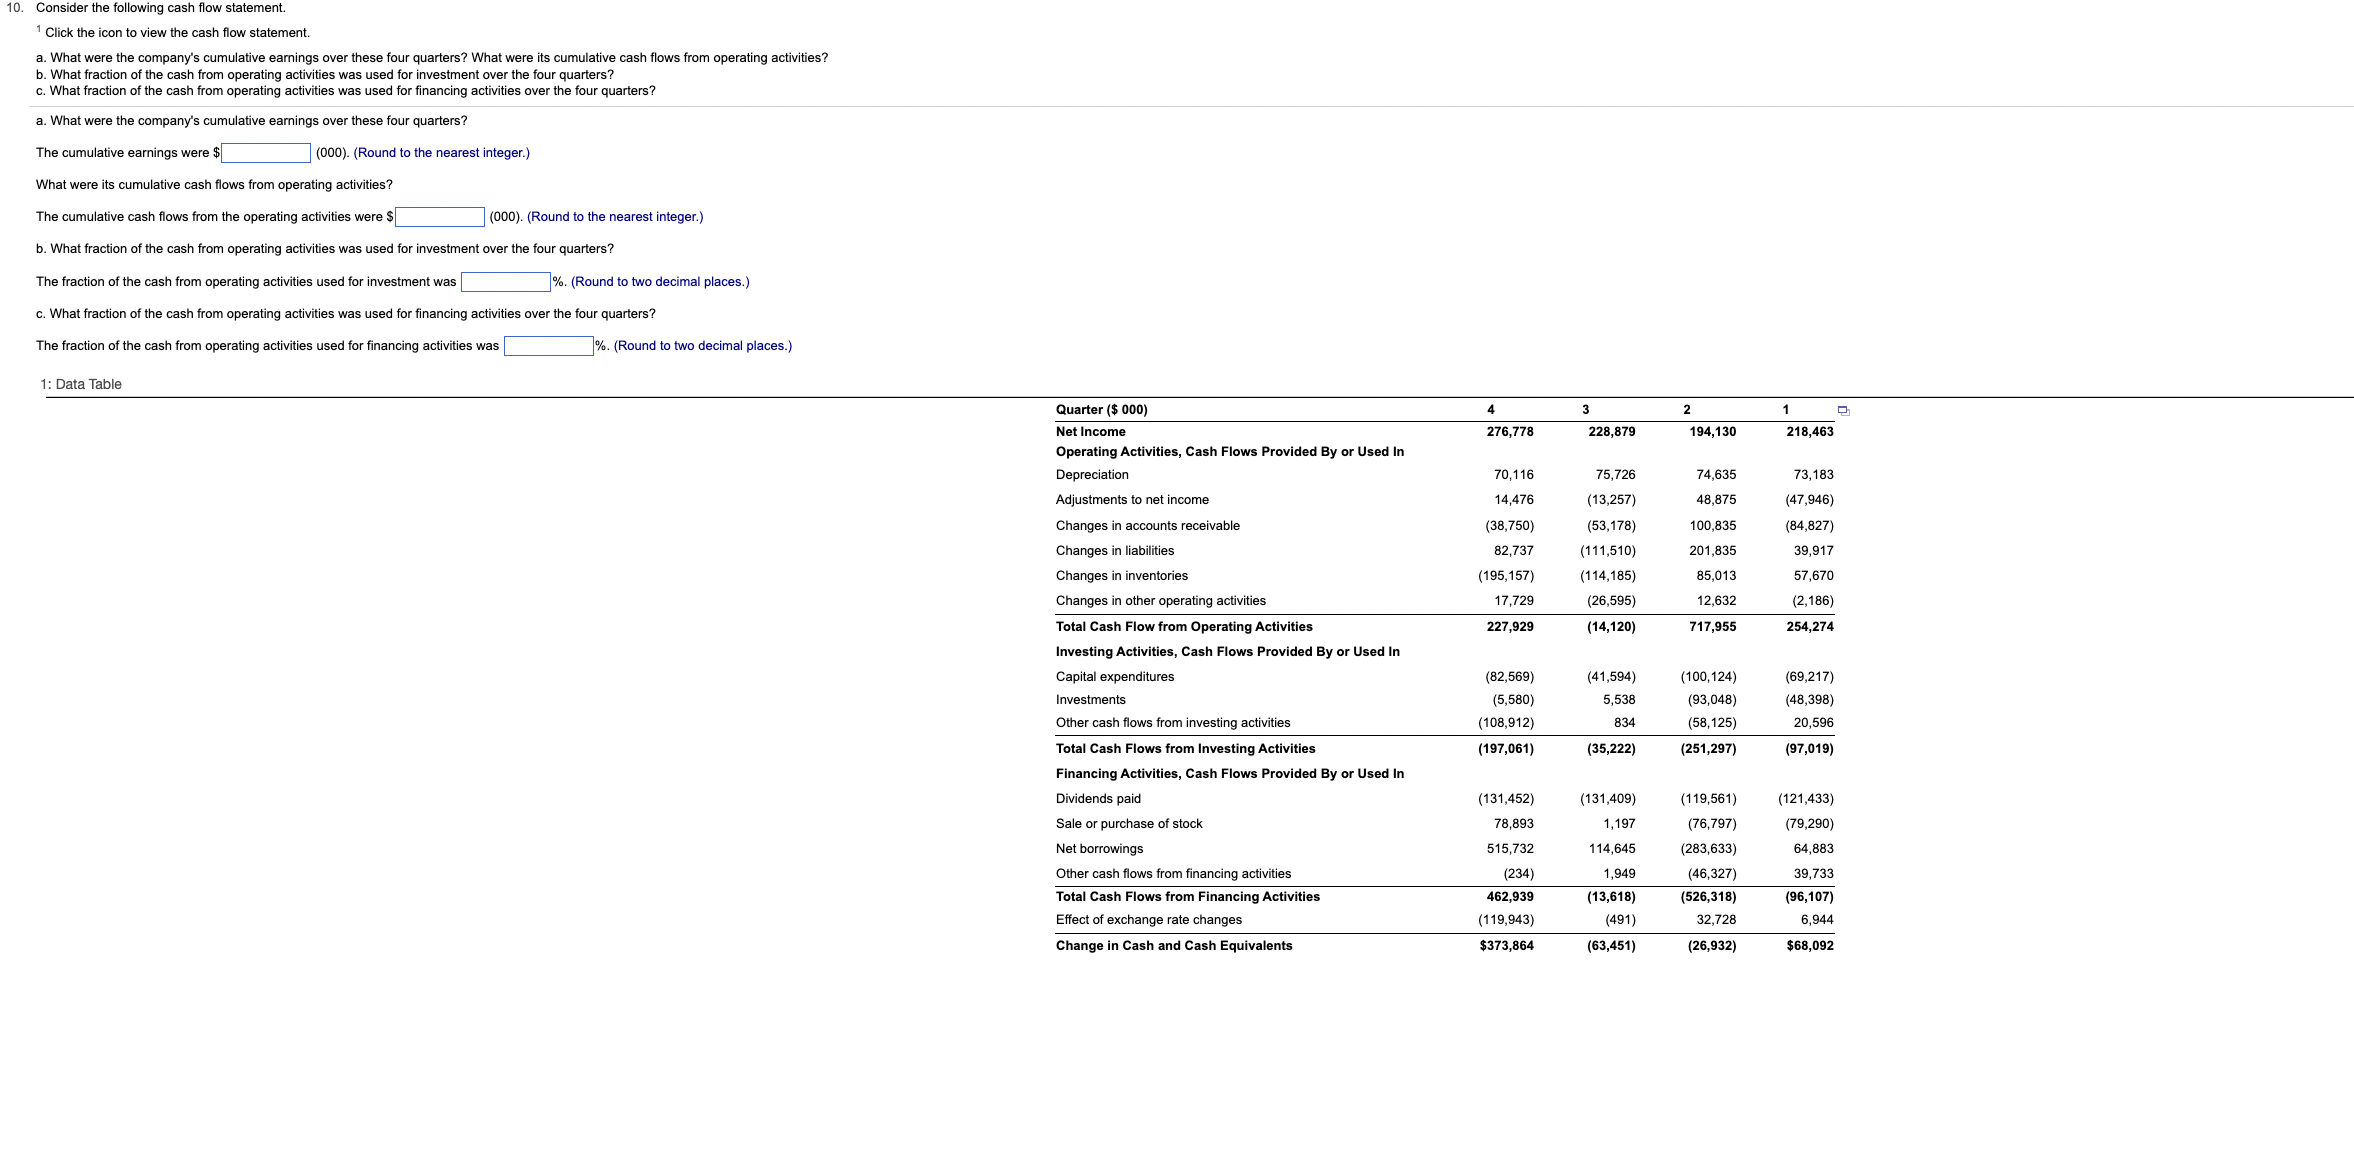
. Consider the financial statement data and stock price data for Mydeco Corp. 1 Click the icon to view the financial statement and stock price data. a. By what percentage did Mydeco's revenues grow each year from 2015 to 2018? By what percentage did net income grow each year c. Why might the growth rates of revenues and net income differ? a. By what percentage did Mydeco's revenues grow each year from 2015 to 2018? The revenues growth for year 2015 is %. (Round to two decimal places.) The revenues growth for year 2016 is %. (Round to two decimal places.) The revenues growth for year 2017 is %. (Round to two decimal places.) The revenues growth for year 2018 is %. (Round to two decimal places.) b. By what percentage did net income grow each year? The net income growth for year 2015 is %. (Round to two decimal places.) The net income growth for year 2016 is %. (Round to two decimal places.) The net income growth for year 2017 is %. (Round to two decimal places.) The net income growth for year 2018 is %. (Round to two decimal places.) c. Why might the growth rates of revenues and net income differ? (Select from the drop-down menus.) Net income growth rate differs from revenue growth rate because cost of goods sold and other expenses can move at different rates than revenues. For example, revenues (1). in 2015 by 9.57%; however, cost of goods sold (2) - by 7.47%. : Data Table 2014-2018 Financial Statement Data and Stock Price Data for Mydeco Corp. (All data as of fiscal year end; in $ millions) Income Statement 2014 2015 2016 2017 2018 Revenue 404.6 365.9 424.1 512.5 603.3 Cost of Goods Sold 183.4 (169.7) (204.8) 243.2 294.1 Gross Profit 221.2 196.2 219.3 269.3 309.2 Sales and Marketing (65.0 (68.0) (83.4) 102.6) (118.2) Administration (59.7) (59.3) (59.9) (64.7) (78.9) Depreciation & Amortization (26.5) (28.9) (32.5) 38.8) (38.7) EBIT 70.0 40.0 43.5 63.2 73.4 nterest Income (Expense) (32.3) (31.5) 33.0) (35.8) (38.7) Pretax Income 37.7 8.5 10.5 27.4 34.7 Income Tax 13.2) (3.0) (3.7 ) (9.6) 12.1) Net Income 24.5 5.5 6.8 17.8 22.6 Shares Outstanding (millions) 55.7 55.7 55,7 55.7 55.7 Earnings per Share $0.44 $0.10 $0.12 $0.32 $0.41 Balance Sheet 2014 2015 2016 2017 2018 Assets Cash 49.9 73.1 87.6 32. 90.9 Accounts Receivable 88.8 70.1 69.7 78.1 85.8 Inventory 32.2 30.8 29.9 33.2 36 1 Total Current Assets 170.9 174.0 187.2 194.0 212.8 Net Property, Plant & Equipment 248.8 240.4 312.7 349.6 47.9 Goodwill & Intangibles 366.7 366.7 366.7 366.7 366.7 Total Assets 786.4 781.1 866.6 910.3 327.4 Liabilities & Stockholders' Equity Accounts Payable 17.1 18.1 23.8 28.7 31.7 Accrued Compensation 7.5 6.6 6.7 9.6 Total Current Liabilities 24.6 24.7 30.5 37.4 41.3 Long-Term Debt 498.7 498.7 575.4 600.2 600.2 Total Liabilities 523.3 523.4 605.9 637.6 $41.5 Stockholders' Equity 263.1 257.7 260,7 272.7 285.9 Total Liabilities & Stockholders' 786.4 781.1 866.6 910.3 927.4 Equity Statement of Cash Flows 2014 2015 2016 2017 2018 Net Income 24.5 5.5 6.8 17.8 22.6 Depreciation & Amortization 26.5 28.9 32.5 38.8 38.7 Change in Accounts Receivable 3.9 18.7 0.4 (8.4) 7.7) Change in Inventory 2.9) 1.4 0.9 3.3) (2.9) Change in Pay. & Accrued Comp. 2.7 0.1 5 .8 6.9 3.9 Cash from Operations 54.7 54.6 46.4 51.8 54.6 Capital Expenditures ( 23.1 ) (25.7 ) 102.9) (75.8 ) (39.4) Cash from Investing Activ. (23.1 (25.7 (102.9) ( 75 .8 ) 39.4 ) Dividends Paid (5.7 ) (5.7) (5.7) ( 5.7 ) ( 7.0 )2014201 8 Financial Statement Data and Stock Price Data for Mydeco Corp. (All data as of scal year end; in S millions} Income Statement 2014 2015 2016 201? 2018 Revenue 404.5 355.9 424.1 512.5 503.3 Cost of Goods Sold (133.4) (159.?) {2043) {2432) (294.1) Gross Prot 221.2 195.2 219.3 259.3 309.2 Sales and Marketing {35.9) {53.9) (33-1) {192.51 (1132) Administration {59?} {59.3) (59.9) (54.?) {?3.9) Depreciation 8. Amortization (25.5) {23.9) (32.5) (33.3) {33.?) EBIT ?0.0 40.0 43.5 53.2 ?3.4 Interest Income {Expense} {32.3) {31.5) (33.0} (35.8] (38.?) Pretax Income 3?.? 8.5 10.5 2?.4 34.? Income Tax {13.2) (3.0) (3.?) (9.5) {12.1) Net Income 24.5 5.5 5.8 1?.8 22.5 Shares Outstanding (millions) 55.? 55.? 55.? 55.? 55.? Earnings per Share $0.44 $0.10 $0.12 $0.32 $0.41 Balance Sheet 2014 2015 2015 201? 2018 Assets Cash 49.9 ?3.1 8 ?.5 82.? 90. 9 Accounts Receivable 88.8 ?0.1 59.? ?8.1 85.8 Inventory 32.2 30.8 29.9 33.2 35.1 Total CurrentAssets 1?0.9 'I?4.0 18?.2 194.0 212.8 Net Property. Plant 8; Equipment 248.8 240.4 312.? 349.5 34?.9 Goodwill Sr Intangibles 355.? 355.? 355.? 355.? 355.? Total Assets 785.4 ?81 .1 855.5 910.3 92?.4 Liabilities 8. Stockholders' Equity Accounts Payable 1?.1 18.1 23.8 28.? 31.? Accrued Compensation ?.5 5.5 5.? 8.? 9.5 Total Current Liabilities 24.5 24.? 30.5 3?.4 41.3 LongTerm Debt 498.? 498.? 5? 5.4 500.2 500.2 Total Liabilities 523.3 523.4 505.9 53?.5 541.5 Stockholders' Equity 253.1 25?.? 250.? 2?2.? 285.9 Total Liabilities 8. Stockholders' ?85.4 ?81.1 855.5 910.3 92?.4 Equityr Statement of Cash Flows 2014 2015 2015 201? 2018 Net Income 24.5 5.5 5.8 1?.8 22.5 Depreciation & Amortization 25.5 28.9 32.5 38.8 38.? Change in Accounts Receivable 3.9 18.? 0.4 (8.4] (?.?J Change in Inventory (2.9) 1.4 0.9 (3.3] (2.9] Change in Pay. 8. Accrued Comp. 2.? 0.1 5.8 5.9 3.9 Cash from Operations 54.? 54.5 45.4 51.8 54.5 Capital Expenditures {23.1 J {25.?) {132.3} (?5.3) {39.4) Cash from Investing Activ. {23.1) (25.?) {102.9} (?5.8J (39.4) Dividends Paid (5.?) (5.?) (5.?) (5.?) (?.0] Sale (or Purchase} of Stock - - - - - Debt Issuance (Pay Down} - ?5.? 24.8 Cash from Financing Activ. (5.?) (5.?) ?'I.0 19.1 (?.0) Change in Cash 25.9 23.2 14.5 (4.9] 8.2 Mydeco Stock Price $8.88 $4.05 $5.1? $8.02 $11.35 10. Consider the following cash flow statement. Click the icon to view the cash flow statement. a. What were the company's cumulative earnings over these four quarters? What were its cumulative cash flows from operating activities? b. What fraction of the cash from operating activities was used for investment over the four quarters? c. What fraction of the cash from operating activities was used for financing activities over the four quarters? a. What were the company's cumulative earnings over these four quarters? The cumulative earnings were $ (000). (Round to the nearest integer.) What were its cumulative cash flows from operating activities? The cumulative cash flows from the operating activities were $ (000). (Round to the nearest integer.) b. What fraction of the cash from operating activities was used for investment over the four quarters? The fraction of the cash from operating activities used for investment was %. (Round to two decimal places.) c. What fraction of the cash from operating activities was used for financing activities over the four quarters? The fraction of the cash from operating activities used for financing activities was %. (Round to two decimal places.) 1: Data Table Quarter ($ 000) 4 3 2 1 Net Income 276,778 228,879 194,130 218,463 Operating Activities, Cash Flows Provided By or Used In Depreciation 70,116 75,726 74,635 73,183 Adjustments to net income 14,476 (13,257) 48,875 (47,946) Changes in accounts receivable (38,750) (53,178) 100,835 (84,827) Changes in liabilities 82,737 (111,510) 201,835 39,917 Changes in inventories (195,157) (114,185 85,013 57,670 Changes in other operating activities 17,729 (26,595) 12,632 (2,186 Total Cash Flow from Operating Activities 227,929 (14,120) 717,955 254,274 Investing Activities, Cash Flows Provided By or Used In Capital expenditure 82,569) (41,594) (100, 124) (69,217) Investments (5,580) 5,538 93,048) 48,398) Other cash flows from investing activities (108,912 834 (58, 125) 20,596 Total Cash Flows from Investing Activities 197,061) (35,222) (251,297) 97,019) Financing Activities, Cash Flows Provided By or Used In Dividends paid (131,452) (131,409) 119,561) (121,433) Sale or purchase of stock 78.893 ,197 (76,797) 79,290) Net borrowings 615,732 114,645 (283,633) 64,883 Other cash flows from financing activities (234 ,94 (46,327) 39,733 Total Cash Flows from Financing Activities 462,939 (13,618) (526,318 (96,107) Effect of exchange rate changes (119,943) 491 32,728 5,944 Change in Cash and Cash Equivalents $373,864 (63,451) (26,932) $68,092You are a shareholder in a corporation. The corporation earns $3 per share before taxes. Once it has paid taxes, it will distribute the rest of its earnings to you as a dividend. The corporate tax rate is 42%, the personal tax rate on dividend income is 30%, and the personal tax rate on other income is 42%. How much is left for you after all taxes are paid? The amount that remains is $ per share. (Round to the nearest cent.)
Step by Step Solution
There are 3 Steps involved in it

Get step-by-step solutions from verified subject matter experts