

Question: 1/29/23, 11:07 AM .16. Consider the financial statement data and stock price data for Mydeco Corp. Click the icon to view the financial state ment
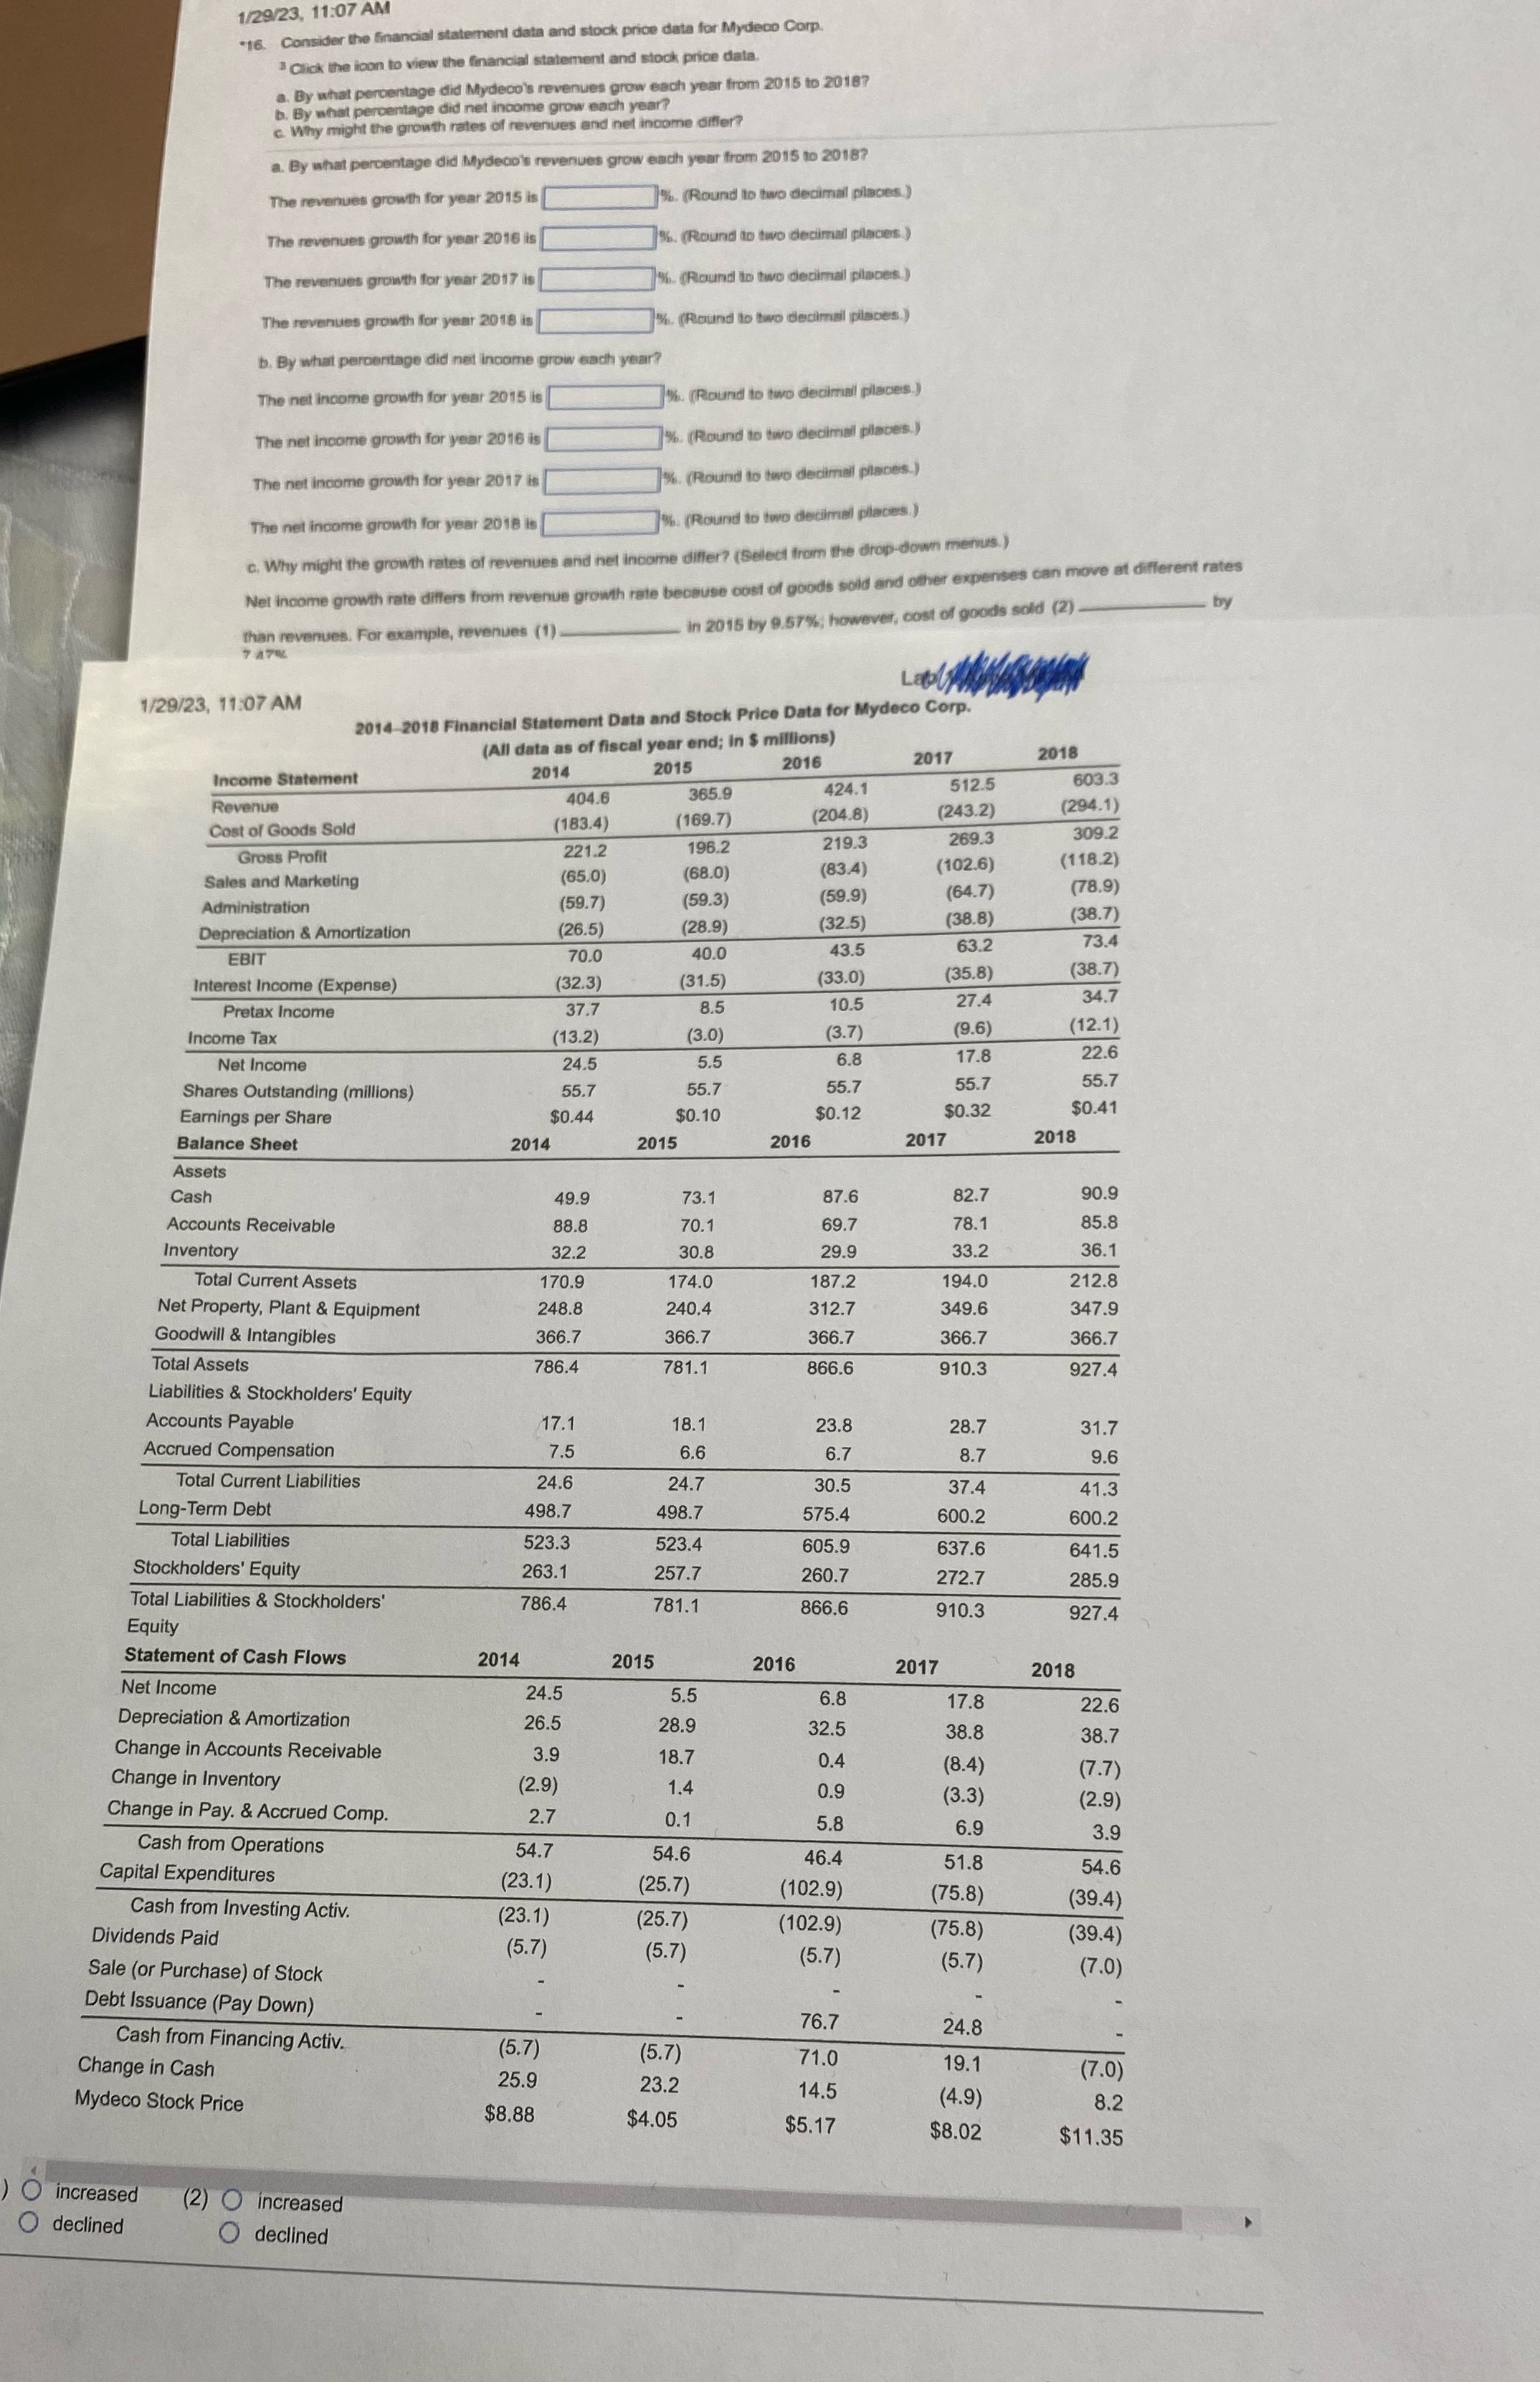
1/29/23, 11:07 AM .16. Consider the financial statement data and stock price data for Mydeco Corp. Click the icon to view the financial state ment and stock price data. a. By what percentage did Mydeco's revenues grow each year from 2015 to 2018? percentage did net income grow each year? b. By what percentage d c. Why might the growth rates of revenues and net income differ? a. By what percentage did Mydeco's revenues grow each year from 2015 to 2018? The revenues growth for year 2015 is %. (Round to two decimal The revenues growth for year 2016 is 6. (Round to two decimal place The revenues growth for year 2017 is "%. (Round to two decimal places.) The revenues growth for year 2018 is %. (Round to two decimal places.) b. By what percentage did net income grow each year? The net income growth for year 2015 is %. (Round to two decimal places.) The net income growth for year 2016 is %. (Round to two decimal places.) %% (Round to two decimal places.) The net income growth for year 2017 is%. (Round to two decimal places.) The net income growth for year 2018 is C. Why might the growth rates of revenues and net income differ? (Select from the drop-down menus.) Net income growth rate differs from revenue growth rate because cost of goods solid and other expenses can move at different rates in 2015 by 9.57%%; however, cost of goods sold (2) than revenues. For example, revenues (1) 1/29/23, 11:07 AM 2014-2018 Financial Statement Data and Stock Price Data for Mydeco Corp. (All data as of fiscal year end; in $ millions) 2017 2018 2014 2015 2016 424. 512.5 603.3 Income Statement 404.6 365.9 243.2) 294.1) Revenue (169.7) Cost of Goods Sold (183.4) (204.8) 219.3 269.3 309.2 221.2 196.2 Gross Profit (65. 68.0) (83.4) (102.6) (118.2) Sales and Marketing (64.7) (78.9) (59.7) (59.3 (59.9) Administration (32.5 (38.8) 38.7 (26.5) (28.9 Depreciation & Amortization 63.2 73.4 70.0 40. 43.5 EBIT (35.8) 38.7) Interest Income (Expense) (32.3) 31.5) 33.0 27.4 34.7 Pretax Income 37.7 8.5 10.5 (3.7) (9.6) 12.1) Income Tax (13.2) (3.0) 6.8 22.6 5.5 17.8 Net Income 24.5 55.7 55.7 55.7 55.7 55.7 Shares Outstanding (millions) $0.32 $0.41 Earnings per Share $0.44 $0.10 $0.12 2017 2018 Balance Sheet 2014 2015 2016 Assets 90.9 49.9 73.1 87.6 82.7 Cash 69.7 78.1 85.8 Accounts Receivable 88.8 70.1 33.2 36.1 Inventory 32.2 30.8 29.9 Total Current Assets 170.9 174.0 187.2 194.0 212.8 Net Property, Plant & Equipment 248.8 240.4 312.7 349.6 347.9 Goodwill & Intangibles 366.7 366.7 366.7 366.7 366.7 781.1 10.3 927.4 Total Assets 786.4 166.6 Liabilities & Stockholders' Equity Accounts Payable 17.1 18.1 23.8 28.7 31.7 Accrued Compensation 7.5 6.6 6.7 8.7 9.6 Total Current Liabilities 24.6 24.7 30.5 37.4 41.3 Long-Term Deb 498.7 498.7 575.4 600.2 600.2 Total Liabilities 523.3 523.4 605.9 637.6 641.5 Stockholders' Equity 263.1 257.7 260.7 272.7 285.9 Total Liabilities & Stockholders 786.4 781.1 366.6 910.3 927.4 Equity Statement of Cash Flows 2014 2015 2016 2017 2018 Net Income 24.5 5.5 6.8 17.8 22.6 Depreciation & Amortization 26.5 28.9 32.5 38.8 38.7 Change in Accounts Receivable 3.9 18.7 0.4 (8.4) (7.7 ) Change in Inventory (2.9) 1.4 0.9 (3.3 (2.9) Change in Pay. & Accrued Comp. 2.7 0.1 5.8 6.9 3.9 Cash from Operations 54. 54.6 46.4 51.8 54.6 Capital Expenditures (23.1 25.7) (102.9) 75.8) 39.4 Cash from Investing Activ. (23.1) (25.7 (102.9 (75.8) (39.4) Dividends Paid (5.7) (5.7) (5.7) (5.7) (7.0) Sale (or Purchase) of Stock Debt Issuance (Pay Down) 76.7 24.8 Cash from Financing Activ. (5.7) (5.7) 71.0 19.1 Change in Cash 7.0 25.9 23.2 14.5 (4.9) 8.2 Mydeco Stock Price $8.88 $4.05 $5.17 $8.02 $11.35 increased (2) O increased declined O declined
Step by Step Solution
There are 3 Steps involved in it

Get step-by-step solutions from verified subject matter experts