

Question: Consider the financial statement data and stock price data for Mydeco Corp. Suppose Mydeco had purchased additional equipment for $12 million at the end of
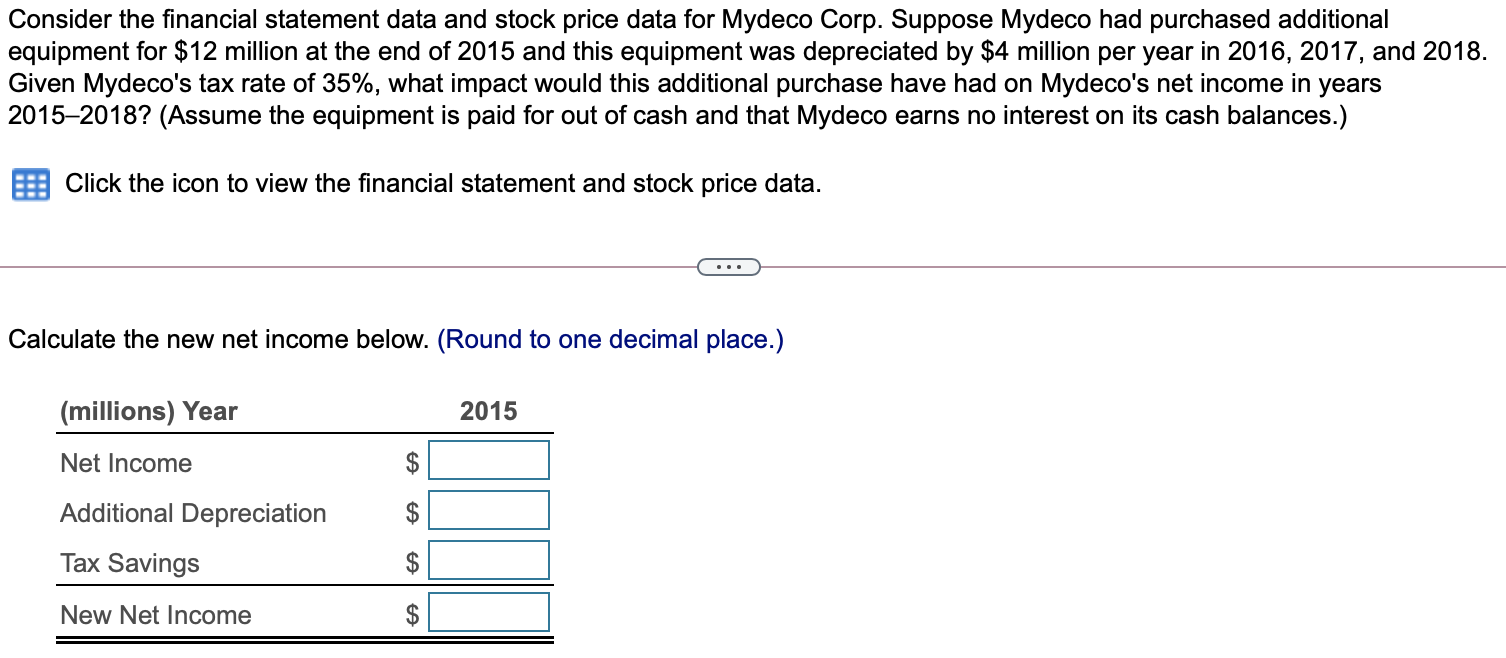
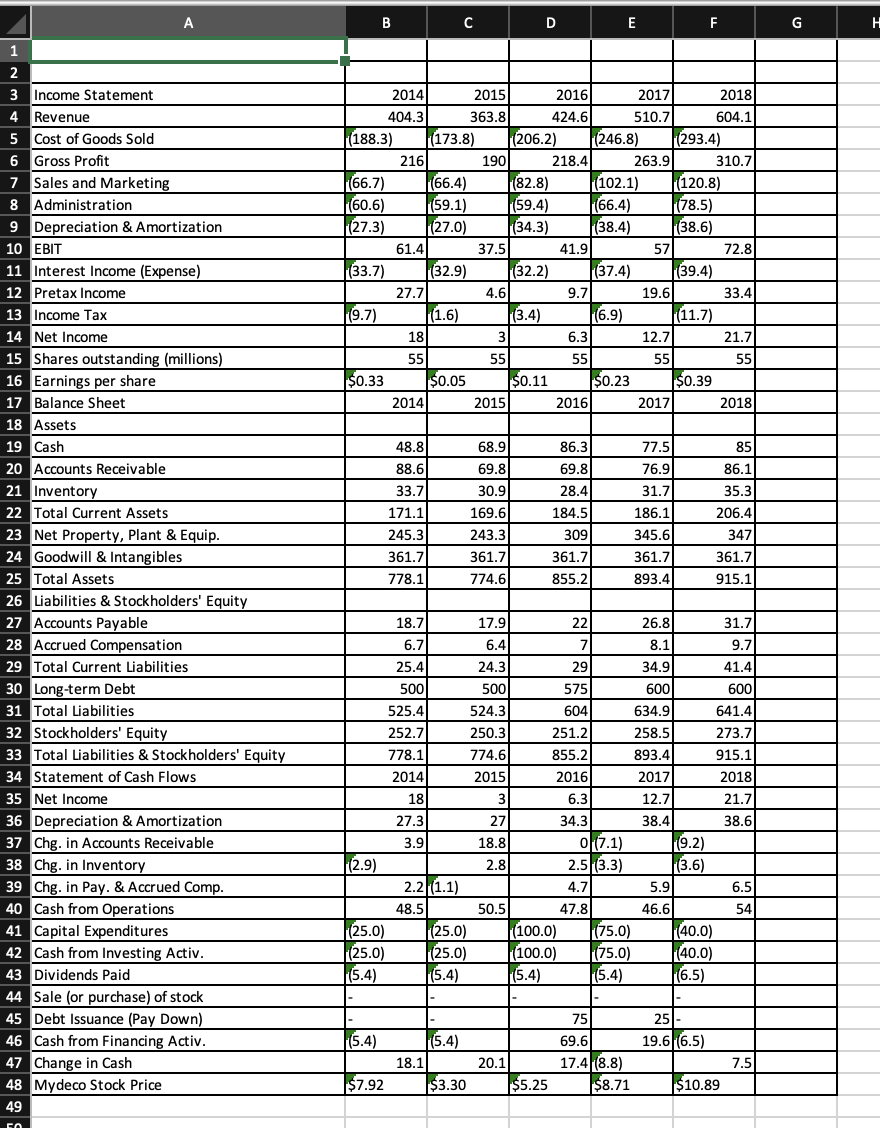
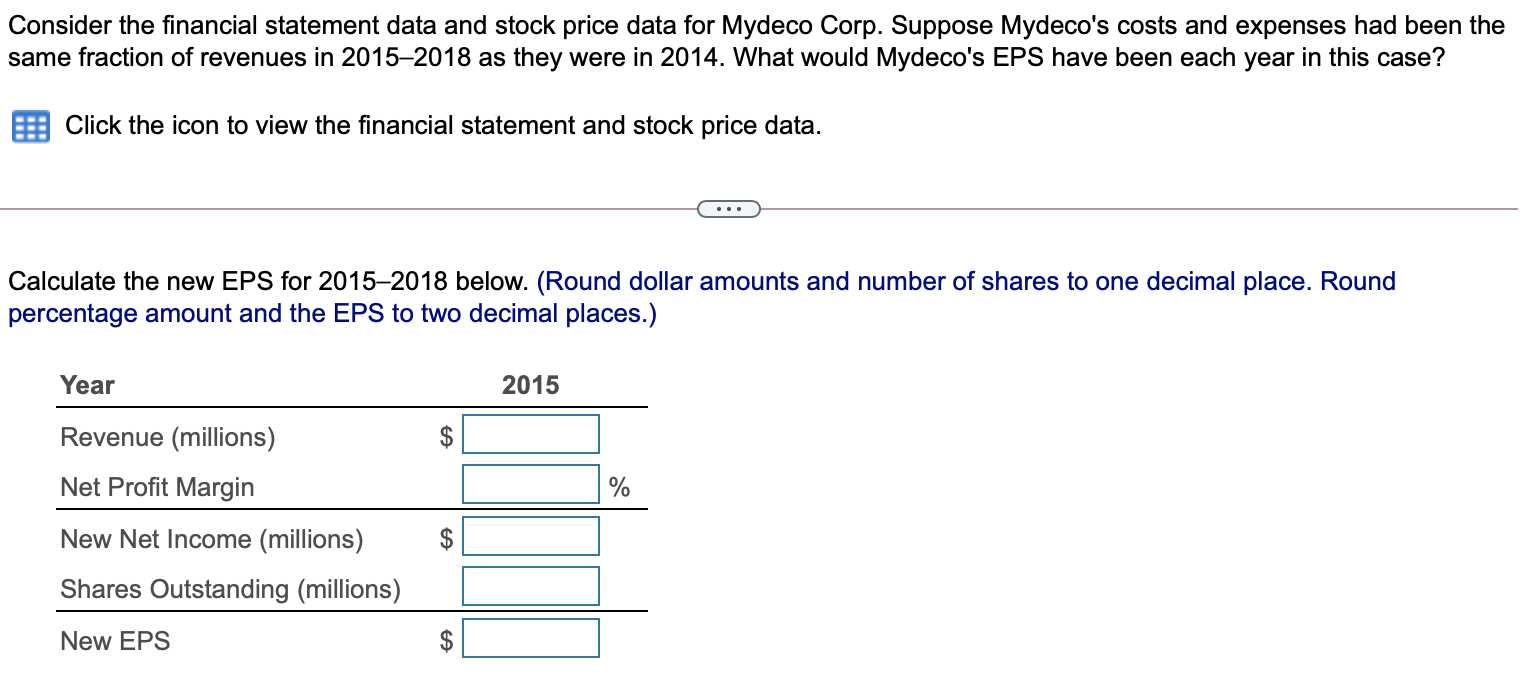
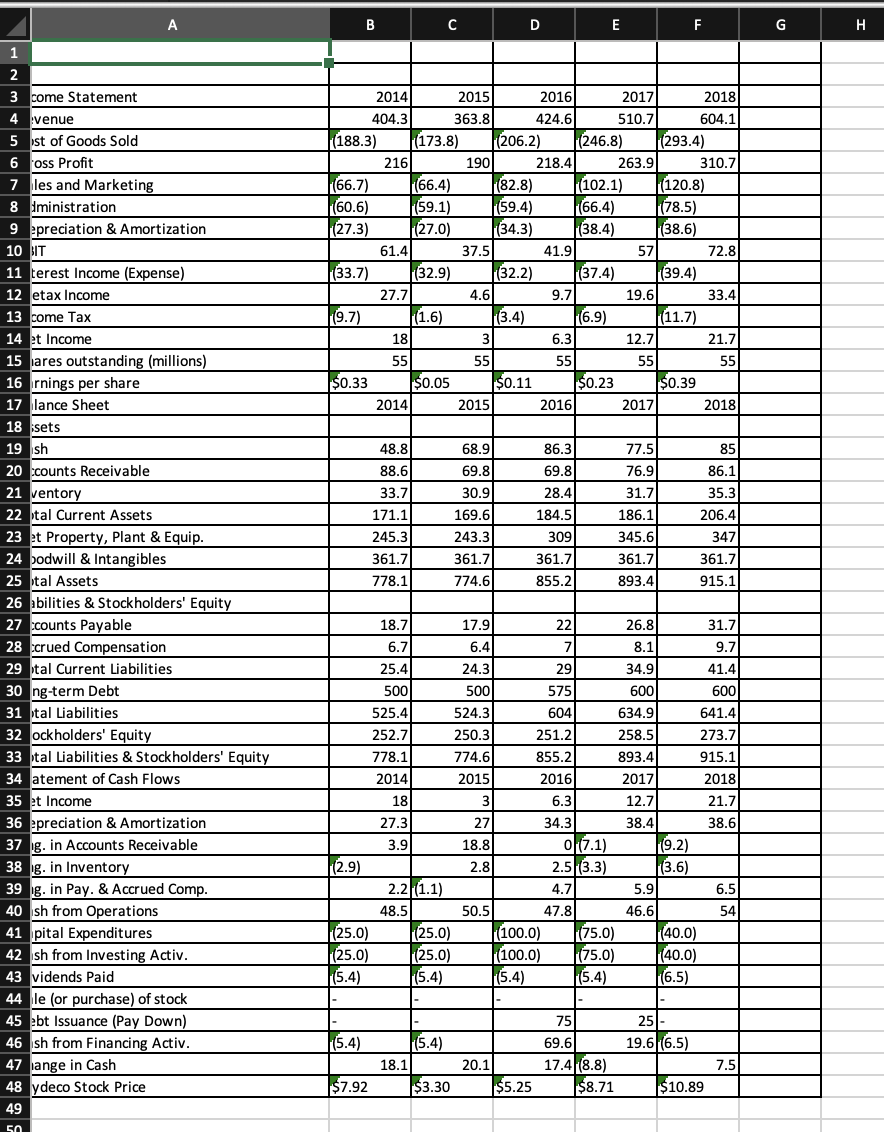
Consider the financial statement data and stock price data for Mydeco Corp. Suppose Mydeco had purchased additional equipment for $12 million at the end of 2015 and this equipment was depreciated by $4 million per year in 2016, 2017, and 2018. Given Mydeco's tax rate of 35%, what impact would this additional purchase have had on Mydeco's net income in years 20152018? (Assume the equipment is paid for out of cash and that Mydeco earns no interest on its cash balances.) Click the icon to view the financial statement and stock price data. Calculate the new net income below. (Round to one decimal place.) (millions) Year 2015 Net Income $ $ Additional Depreciation Tax Savings $ New Net Income $ A B C D E F G H 1 2014 2015 2016 2017 2018 404.3) 363.8 424.6 510.7 604.1 (188.3) (173.8) (206.2) (246.8) (293.4) 216 190 218.4 263.9 310.7 (66.7) (66.4) (82.8) (102.1) (120.8) (60.6) (59.1) (59.4) (66.4) (78.5) (27.3) (27.0) (34.3) (38.4) (38.6) 61.41 37.5 41.91 57 72.8 (33.7) (32.9) (32.2) (37.4) (39.4) 27.7 4.6 9.7 19.6 33.4 (9.7) (1.6) (3.4) (6.9) |(11.7) 181 6.3 12.7 21.7 55 55 551 55 55 $0.33 $0.05 $0.11 $0.23 $0.39 2014 2015 2016) 2017 2018 85 48.8 88.6 33.7 171.1 245.3 361.7 778.1 68.9 69.8 30.9 169.6 243.3 361.7 774.6 86.3 69.8 28.4 184.5 309 77.5 76.9 31.7 186.1 345.6 361.7 893.4 86.1 35.3 206.41 347 361.7 915.1 361.7 855.2 2 3 Income Statement 4 Revenue 5 Cost of Goods Sold 6 Gross Profit 7 Sales and Marketing 8 Administration 9 Depreciation & Amortization 10 EBIT 11 Interest Income (Expense) 12 Pretax Income 13 Income Tax 14 Net Income 15 Shares outstanding (millions) 16 Earnings per share 17 Balance Sheet 18 Assets 19 Cash 20 Accounts Receivable 21 Inventory 22 Total Current Assets 23 Net Property, Plant & Equip. 24 Goodwill & Intangibles 25 Total Assets 26 Liabilities & Stockholders' Equity 27 Accounts Payable 28 Accrued Compensation 29 Total Current Liabilities 30 Long-term Debt 31 Total Liabilities 32 Stockholders' Equity 33 Total Liabilities & Stockholders' Equity 34 Statement of Cash Flows 35 Net Income 36 Depreciation & Amortization 37 Chg. in Accounts Receivable 38 Chg. in Inventory 39 Chg. in Pay. & Accrued Comp. 40 Cash from Operations 41 Capital Expenditures 42 Cash from Investing Activ. 43 Dividends Paid 44 Sale (or purchase) of stock 45 Debt Issuance (Pay Down) 46 Cash from Financing Activ. 47 Change in Cash 48 Mydeco Stock Price 49 18.7 17.9 22 26.8 31.7 6.7 6.4 7 8.1 9.7 25.4 24.3 29 34.9 41.4 5001 500 575 600 600 525.4 524.3 604 634.9 641.4 252.7 250.3 251.2 258.5 273.7 778.1 774.6 855.2 893.4 915.1 2014 2015 2016 2017 2018 18 3 6.3 12.7 21.7 27 34.3 38.4 38.6 3.9 18.8 0 (7.1) (9.2) (2.9) 2.8 2.5 (3.3) (3.6) 2.2 (1.1) 4.7 5.9 6.5 48.5 50.5 47.8 46.6 54 (25.0) (25.0) (100.0) (75.0) (40.0) |(25.0) (25.0) (100.0) (75.0) (40.0) (5.4) (5.4) (5.4) (5.4) |(6.5) 27.3 25- 19.6(6.5) (5.4) (5.4) 18.1 $3.30 75 69.6 17.48.8) $8.71 7.5 20.1 $5.25 $7.92 $10.89 o Consider the financial statement data and stock price data for Mydeco Corp. Suppose Mydeco's costs and expenses had been the same fraction of revenues in 20152018 as they were in 2014. What would Mydeco's EPS have been each year in this case? Click the icon to view the financial statement and stock price data. Calculate the new EPS for 20152018 below. (Round dollar amounts and number of shares to one decimal place. Round percentage amount and the EPS to two decimal places.) Year 2015 $ % Revenue (millions) Net Profit Margin New Net Income (millions) Shares Outstanding (millions) $ New EPS $ A B D E F G H 1 2014 2015 2016 2017 2018 404.3 363.8 424.6 510.7 604.1 (188.3) (173.8) 206.2) (246.8) (293.4) 216) 190 218.41 263.9 310.7 (66.7) (66.4) (82.8) (102.1) |(120.8) (60.6) (59.1) (59.4) (66.4) (78.5) (27.3) (27.0) (34.3) 38.4) (38.6) 61.4 37.5 41.91 57 72.8 (33.7) (32.9) (32.2) (37.4) (39.4) 27.7 4.6 9.7 19.6 33.4 (9.7) (1.6) (3.4) (6.9) |(11.7) 18 6.3 12.7 21.7 55 55 551 55 55 $0.33 $0.05 $0.11 $0.23 $0.39 2014 2015 2016) 2017 2018 48.8 77.5 88.6 33.7 171.1 245.3 361.7 778.1 68.9 69.8 30.9 169.61 243.3 361.7 774.6) 86.3 69.8 28.4 184.5 309 361.7 855.2 76.9 31.7 186.1 345.6 85 86.1 35.3 206.4 347 361.7 915.1 361.7 893.4 2 3 come Statement 4 venue 5 st of Goods Sold 6 oss Profit 7 les and Marketing 8 dministration 9 epreciation & Amortization 10 BIT 11 terest Income (Expense) 12 etax Income 13 come Tax 14 et Income 15 ares outstanding (millions) 16 rnings per share 17 lance Sheet 18 ksets 19 sh 20 counts Receivable 21 ventory 22 btal Current Assets 23 at Property, Plant & Equip. 24 podwill & Intangibles 25 tal Assets 26 abilities & Stockholders' Equity 27 counts Payable 28 ccrued Compensation 29 tal Current Liabilities 30 ng-term Debt 31 ptal Liabilities 32 ockholders' Equity 33 tal Liabilities & Stockholders' Equity 34 atement of Cash Flows 35 et Income 36 apreciation & Amortization 37 g. in Accounts Receivable 38 g. in Inventory 39 g. in Pay. & Accrued Comp. 40 sh from Operations 41 pital Expenditures 42 sh from Investing Activ. 43 vidends Paid 44 le (or purchase) of stock 45 abt Issuance (Pay Down) 46 sh from Financing Activ. 47 lange in Cash 48 ydeco Stock Price 49 25.4 18.7 17.9 22 26.8 31.7 6.7 6.4 7 8.1 9.7 24.3 29 34.9 41.4 500 500 575 6001 600 525.4 524.3 604 634.9 641.4 252.7 250.3 251.2 258.5 273.7 778.1 774.61 855.2 893.4 915.1 2014 2015 2016 2017 2018 18 3 6.3 12.7 21.7 27.3 27 34.31 38.4 38.6 3.9 18.8 0 (7.1) 119.2) (2.9) 2.8 2.5 (3.3) (3.6) 2.2 (1.1) 4.7 5.9 6.5 48.5 50.5 47.8 46.61 54 (25.0) (25.0) (100.0) (75.0) |(40.0) (25.0) (25.0) (100.0) (75.0) (40.0) (5.4) (5.4) (6.5) (5.4) (5.4) 251 19.6 (6.5) (5.4) (5.4) 18.1 $3.30 75 69.6 17.4|(8.8) $8.71 7.5 20.1 $5.25 $7.92 $10.89 50
Step by Step Solution
There are 3 Steps involved in it

Get step-by-step solutions from verified subject matter experts