

Question: Consider the financial statement data and stock price data for Mydeco Corp. Suppose Mydeco had purchased additional equipment for $12 million at the end of
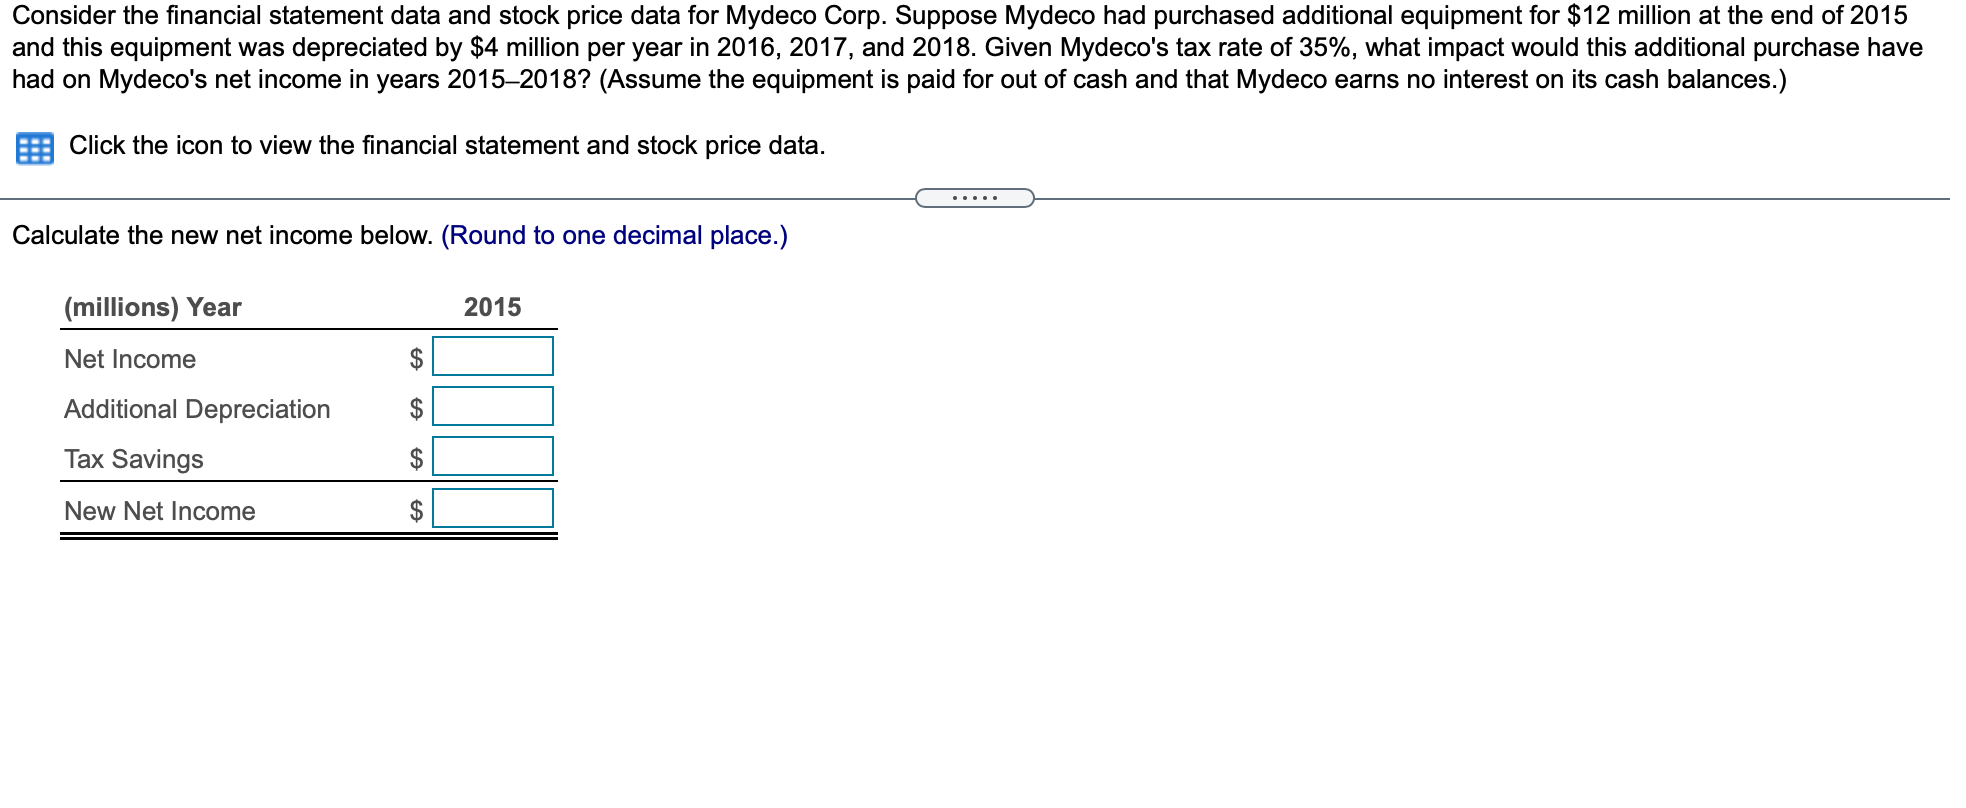
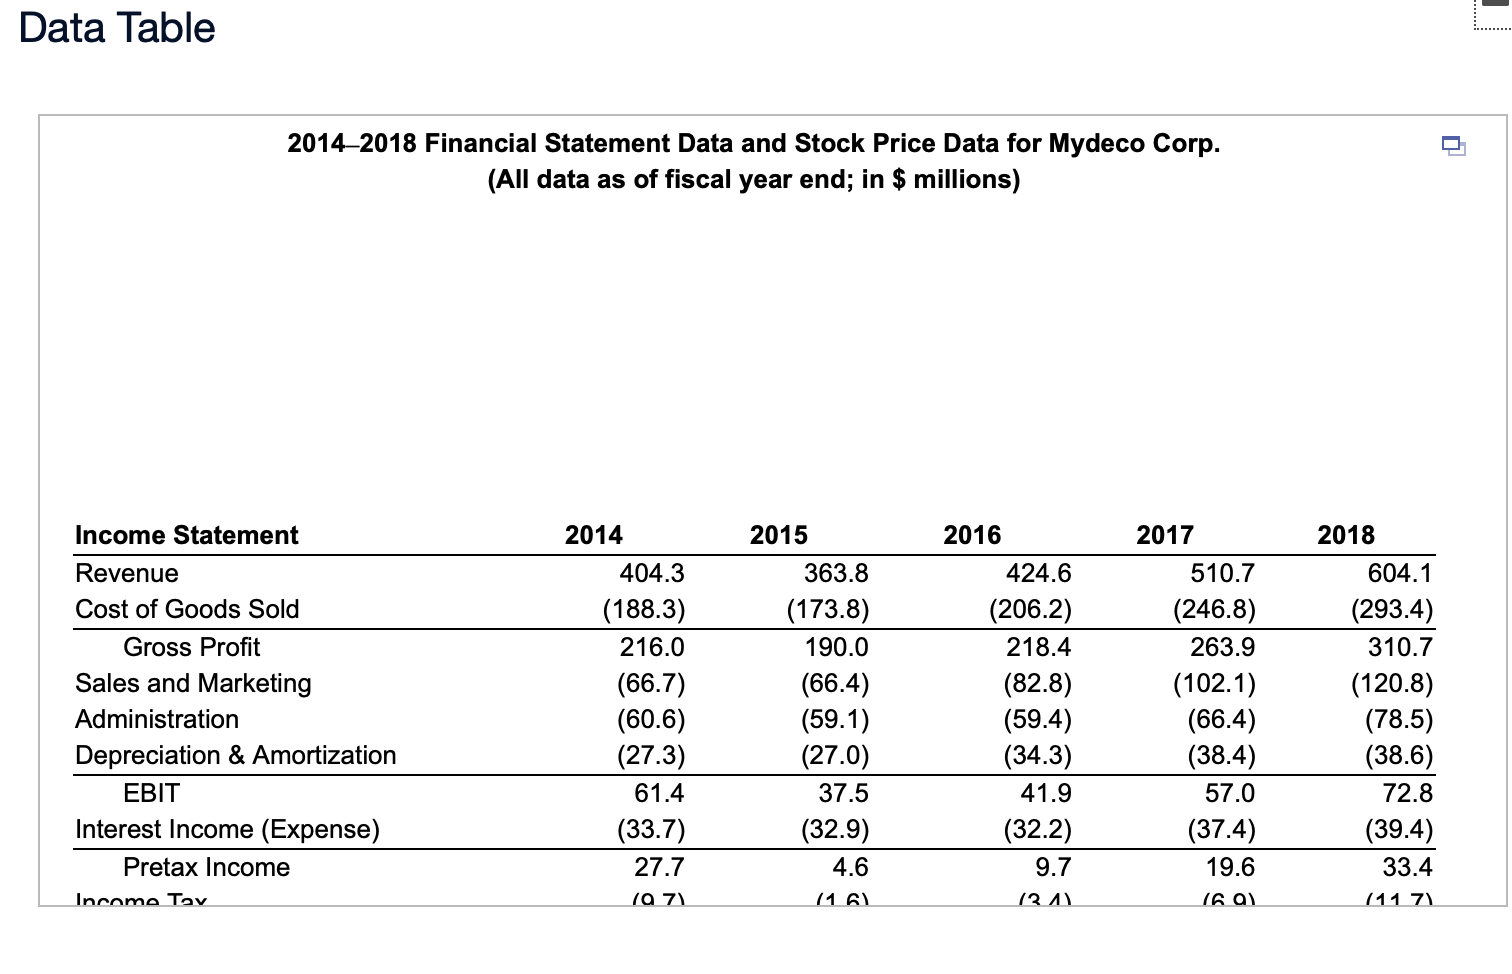

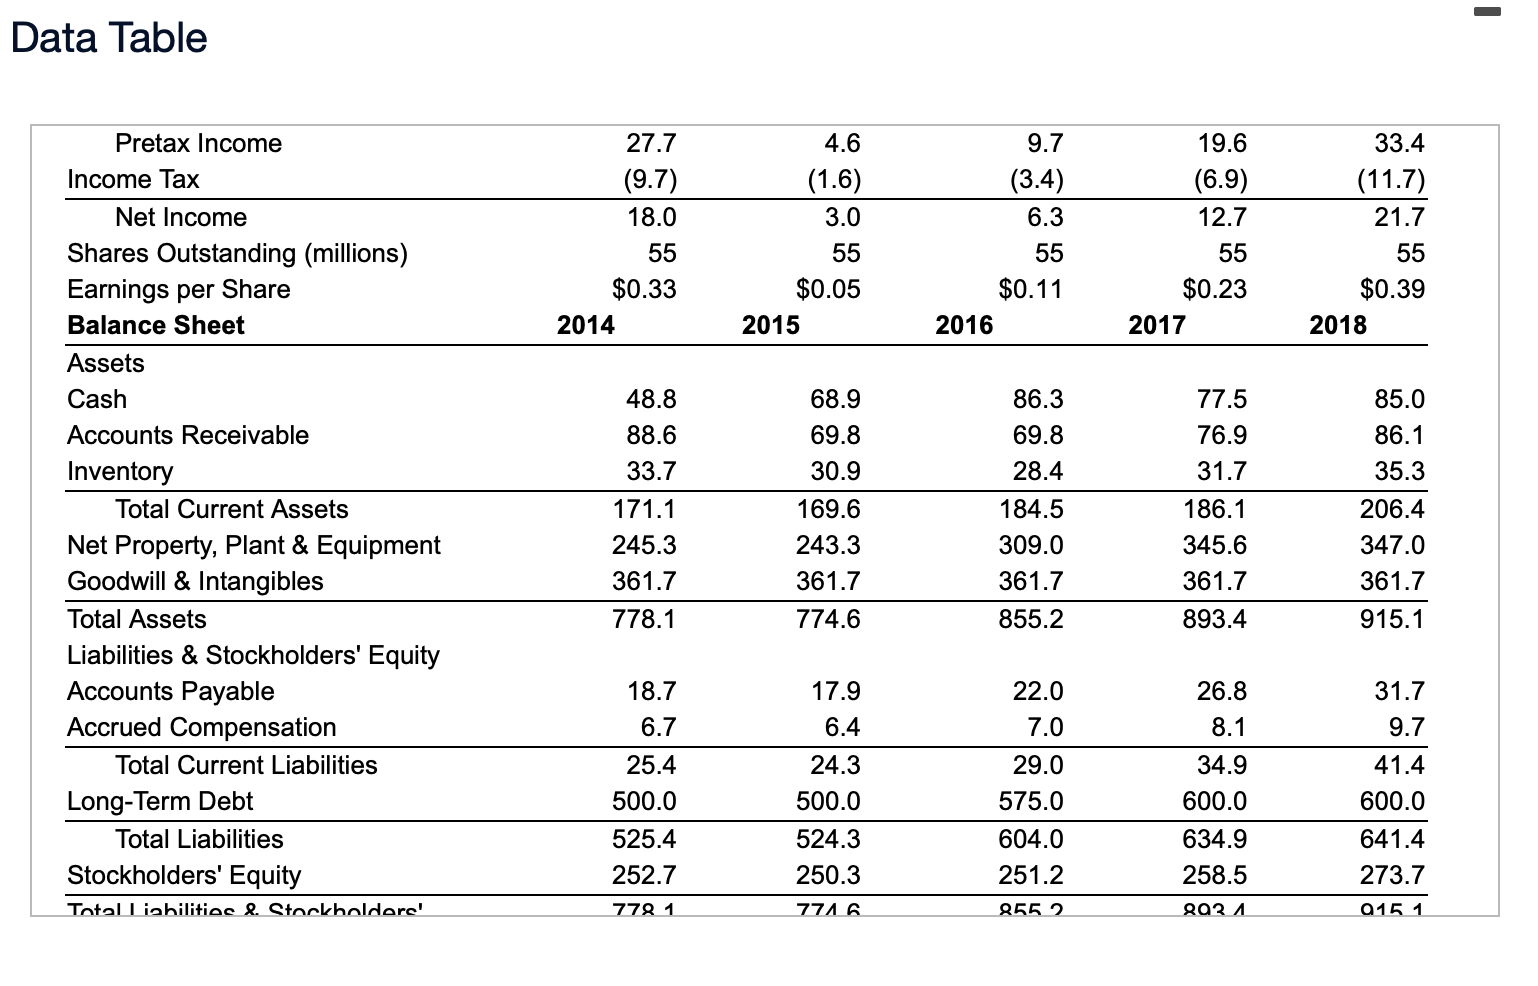
Consider the financial statement data and stock price data for Mydeco Corp. Suppose Mydeco had purchased additional equipment for $12 million at the end of 2015 and this equipment was depreciated by $4 million per year in 2016, 2017, and 2018. Given Mydeco's tax rate of 35%, what impact would this additional purchase have had on Mydeco's net income in years 20152018? (Assume the equipment is paid for out of cash and that Mydeco earns no interest on its cash balances.) Click the icon to view the financial statement and stock price data. Calculate the new net income below. (Round to one decimal place.) (millions) Year 2015 Net Income Additional Depreciation $ $ $ $ Tax Savings New Net Income I Data Table 20142018 Financial Statement Data and Stock Price Data for Mydeco Corp. (All data as of fiscal year end; in $ millions) 2018 Income Statement Revenue Cost of Goods Sold Gross Profit Sales and Marketing Administration Depreciation & Amortization EBIT Interest Income (Expense) Pretax Income Income Tav 2014 404.3 (188.3) 216.0 (66.7) (60.6) (27.3) 61.4 (33.7) 27.7 2015 363.8 (173.8) 190.0 (66.4) (59.1) (27.0) 37.5 (32.9) 4.6 2016 424.6 (206.2) 218.4 (82.8) (59.4) (34.3) 41.9 (32.2) 9.7 2017 510.7 (246.8) 263.9 (102.1) (66.4) (38.4) 57.0 (37.4) 19.6 604.1 (293.4) 310.7 (120.8) (78.5) (38.6) 72.8 (39.4) 33.4 71 1161 1341 16 al 111 71 - Data Table 27.7 (9.7) 18.0 55 $0.33 2014 4.6 (1.6) 3.0 55 $0.05 2015 9.7 (3.4) 6.3 55 $0.11 2016 19.6 (6.9) 12.7 55 $0.23 2017 33.4 (11.7) 21.7 55 $0.39 2018 68.9 Pretax Income Income Tax Net Income Shares Outstanding (millions) Earnings per Share Balance Sheet Assets Cash Accounts Receivable Inventory Total Current Assets Net Property, Plant & Equipment Goodwill & Intangibles Total Assets Liabilities & Stockholders' Equity Accounts Payable Accrued Compensation Total Current Liabilities Long-Term Debt Total Liabilities Stockholders' Equity Total liabilities & Stockholders' 48.8 88.6 33.7 171.1 245.3 361.7 778.1 69.8 30.9 169.6 243.3 361.7 774.6 86.3 69.8 28.4 184.5 309.0 361.7 855.2 77.5 76.9 31.7 186.1 345.6 361.7 893.4 85.0 86.1 35.3 206.4 347.0 361.7 915.1 18.7 6.7 22.0 7.0 26.8 8.1 31.7 9.7 25.4 500.0 525.4 252.7 17.9 6.4 24.3 500.0 524.3 250.3 29.0 575.0 604.0 251.2 34.9 600.0 634.9 258.5 41.4 600.0 641.4 273.7 0151 7781 7716 8552 8024 - Data Table 27.7 (9.7) 18.0 55 $0.33 2014 4.6 (1.6) 3.0 55 $0.05 2015 9.7 (3.4) 6.3 55 $0.11 2016 19.6 (6.9) 12.7 55 $0.23 2017 33.4 (11.7) 21.7 55 $0.39 2018 68.9 Pretax Income Income Tax Net Income Shares Outstanding (millions) Earnings per Share Balance Sheet Assets Cash Accounts Receivable Inventory Total Current Assets Net Property, Plant & Equipment Goodwill & Intangibles Total Assets Liabilities & Stockholders' Equity Accounts Payable Accrued Compensation Total Current Liabilities Long-Term Debt Total Liabilities Stockholders' Equity Total liabilities & Stockholders' 48.8 88.6 33.7 171.1 245.3 361.7 778.1 69.8 30.9 169.6 243.3 361.7 774.6 86.3 69.8 28.4 184.5 309.0 361.7 855.2 77.5 76.9 31.7 186.1 345.6 361.7 893.4 85.0 86.1 35.3 206.4 347.0 361.7 915.1 18.7 6.7 22.0 7.0 26.8 8.1 31.7 9.7 25.4 500.0 525.4 252.7 17.9 6.4 24.3 500.0 524.3 250.3 29.0 575.0 604.0 251.2 34.9 600.0 634.9 258.5 41.4 600.0 641.4 273.7 0151 7781 7716 8552 8024
Step by Step Solution
There are 3 Steps involved in it

Get step-by-step solutions from verified subject matter experts