

Question: Consider the financial statement data and stock price data for Mydeco Corp. Suppose Mydeco's costs and expenses had been the same fraction of revenues in
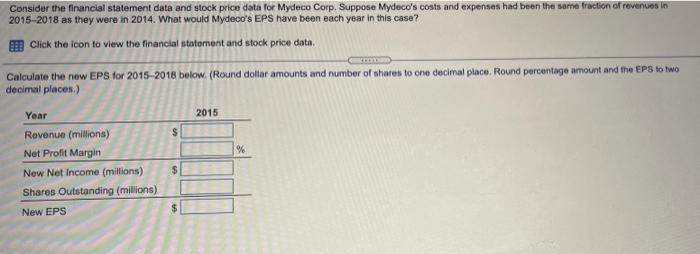
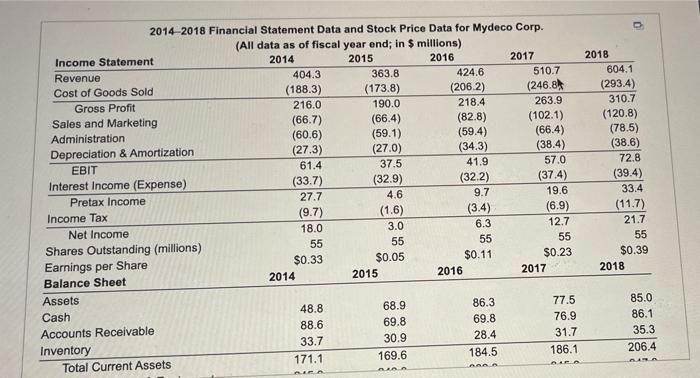
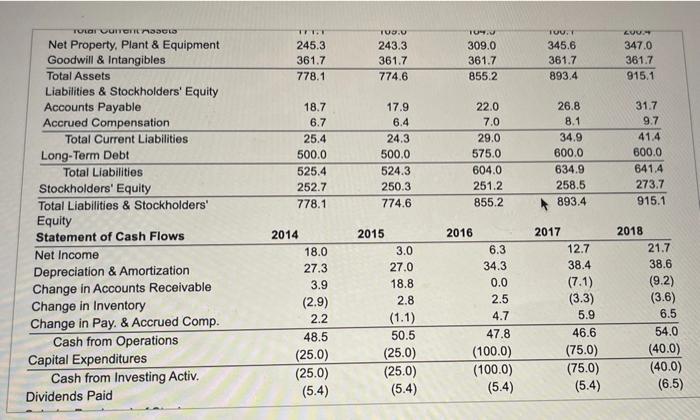
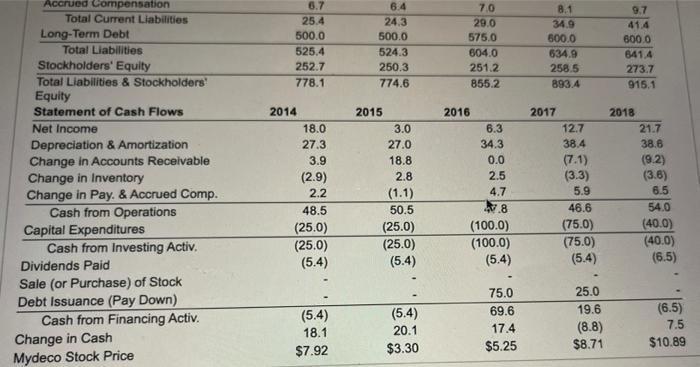
Consider the financial statement data and stock price data for Mydeco Corp. Suppose Mydeco's costs and expenses had been the same fraction of revenues in 2015-2018 as they were in 2014. What would Mydeco's EPS have been each year in this case? Click the icon to view the financial statoment and stock price data Calculate the new EPS for 2015-2018 below. (Round dollar amounts and number of shares to one decimal place. Round percentage amount and the EPs to wo decimal places.) 2015 $ % Year Revenue (millions) Net Profit Margin New Net Income (millions) Shares Outstanding (milions) New EPS $ $ 2014-2018 Financial Statement Data and Stock Price Data for Mydeco Corp. (All data as of fiscal year end; in $ millions) Income Statement 2014 2015 2016 2017 Revenue 404.3 363.8 424.6 510.7 Cost of Goods Sold (188.3) (173.8) (2062) (246.8% Gross Profit 216.0 190.0 218.4 263.9 Sales and Marketing (66.7) (66.4) (82.8) (102.1) Administration (60.6) (59.1) (59.4) (66.4) Depreciation & Amortization (27.3) (27.0) (34.3) (38.4) EBIT 61.4 37.5 41.9 57.0 Interest Income (Expense) (33.7) (32.9) (32.2) (37.4) Pretax Income 27.7 4.6 9.7 19.6 Income Tax (9.7) (1.6) (3.4) (6.9) 3.0 18.0 6.3 12.7 Net Income 55 55 55 55 Shares Outstanding (millions) $0.33 $0.05 $0.11 $0.23 Earnings per Share 2015 2017 2014 2016 Balance Sheet Assets 48.8 68.9 86.3 77.5 Cash 88.6 69.8 69.8 76.9 Accounts Receivable 33.7 30.9 31.7 28.4 Inventory 169.6 186.1 184.5 171.1 Total Current Assets ARO 2018 604.1 (293.4) 310.7 (120.8) (78.5) (38.6) 72.8 (39.4) 33.4 (11.7) 21.7 55 $0.39 2018 85.0 86.1 35.3 206.4 GARA TT. 245.3 361.7 778.1 TUUU 243.3 361.7 774.6 TUY. 309.0 361.7 855 2 TUUT 345.6 361.7 893.4 LU. 347.0 361.7 915.1 18.7 6.7 25.4 500.0 525.4 252.7 778.1 17.9 6.4 24.3 500.0 524.3 250.3 774.6 22.0 7.0 29.0 575.0 604.0 251.2 855.2 26.8 8.1 34.9 600.0 634.9 258.5 893.4 31.7 9.7 41.4 600.0 641.4 273.7 915.1 TULGI UUTTO IL NOSCO Net Property, Plant & Equipment Goodwill & Intangibles Total Assets Liabilities & Stockholders' Equity Accounts Payable Accrued Compensation Total Current Liabilities Long-Term Debt Total Liabilities Stockholders' Equity Total Liabilities & Stockholders Equity Statement of Cash Flows Net Income Depreciation & Amortization Change in Accounts Receivable Change in Inventory Change in Pay. & Accrued Comp. Cash from Operations Capital Expenditures Cash from Investing Activ. Dividends Paid 2014 18.0 27.3 3.9 (2.9) 2.2 48.5 (25.0) (25.0) (5.4) 2015 3.0 27.0 18.8 2.8 (1.1) 50.5 (25.0) (25.0) (5.4) 2016 6.3 34.3 0.0 2.5 4.7 47.8 (100.0) (100.0) (5.4) 2017 12.7 38.4 (7.1) (3.3) 5.9 46.6 (75.0) (75.0) (5.4) 2018 21.7 38.6 (9.2) (3.6) 6.5 54.0 (40.0) (40.0) (6.5) 6.7 25.4 500.0 525.4 252.7 778.1 6.4 24.3 500.0 524.3 250.3 774.6 7.0 29.0 575.0 604.0 251.2 855.2 8.1 34.9 600.0 634.9 258,5 893.4 9.7 41.4 600.0 841.4 273.7 915.1 2016 2017 Accrued Compensation Total Current Liabilities Long-Term Debt Total Liabilities Stockholders' Equity Total Liabilities & Stockholders Equity Statement of Cash Flows Net Income Depreciation & Amortization Change in Accounts Receivable Change in Inventory Change in Pay. & Accrued Comp. Cash from Operations Capital Expenditures Cash from Investing Activ, Dividends Paid Sale (or Purchase) of Stock Debt Issuance (Pay Down) Cash from Financing Activ. Change in Cash Mydeco Stock Price 2014 18.0 27.3 3.9 (2.9) 2.2 48.5 (25.0) (25.0) (5.4) 2015 3.0 27.0 18.8 2.8 (1.1) 50.5 (25.0) (25.0) (5.4) 6.3 34.3 0.0 2.5 4.7 12.7 38.4 (7.1) (3.3) 5.9 46.6 (75.0) (75.0) (5.4) 2018 21.7 38.6 (92) (3.6) 6.5 54.0 (40.0) (40.0) (6.5) 2.8 (100.0) (100.0) (5.4) (5.4) 18.1 $7.92 (5.4) 20.1 $3.30 75.0 69.6 17.4 $5.25 25.0 19.6 (8.8) $8.71 (6.5) 7.5 $10.89
Step by Step Solution
There are 3 Steps involved in it

Get step-by-step solutions from verified subject matter experts