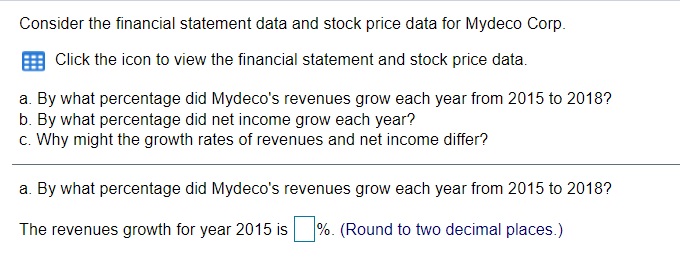
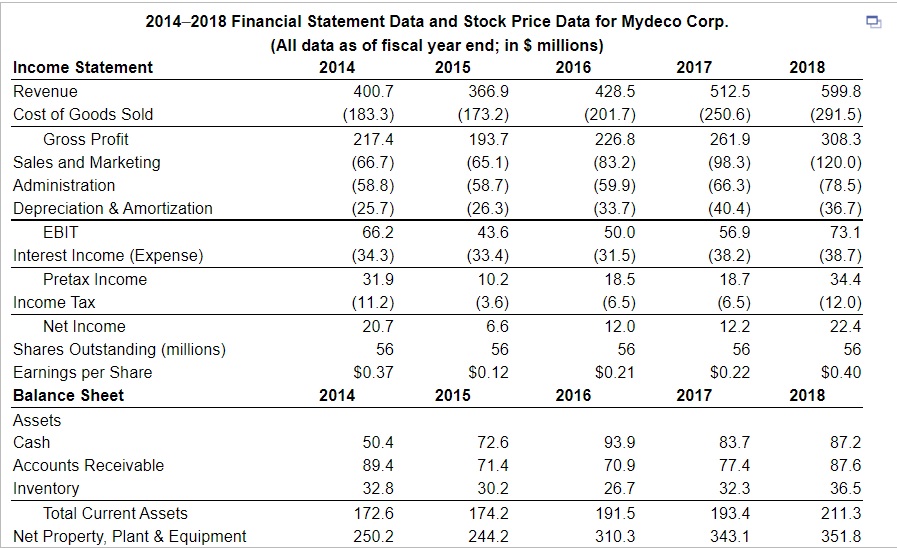
Question: Consider the financial statement data and stock price data for Mydeco Corp. Click the icon to view the financial statement and stock price data. a.

Consider the financial statement data and stockConsider the financial statement data and stockConsider the financial statement data and stockConsider the financial statement data and stock
Consider the financial statement data and stock price data for Mydeco Corp. Click the icon to view the financial statement and stock price data. a. By what percentage did Mydeco's revenues grow each year from 2015 to 2018? b. By what percentage did net income grow each year? c. Why might the growth rates of revenues and net income differ? a. By what percentage did Mydeco's revenues grow each year from 2015 to 2018? The revenues growth for year 2015 is %. (Round to two decimal places.)20142018 Financial Statement Data and Stock Price Data for Mydeco Corp. (All data as of fiscal year end; in $ millions} Income Statement 2014 2015 2016 2017 2013 Revenue 400.7 366.9 428.5 512.5 599.8 Cost of Goods Sold (183.3} (173.2} (201.7} (250.6} (291.5} Gross Prot 217.4 193.7 226.8 261.9 3083 Sales and Marketing (66.7} (65.1} (83.2} (98.3} (120.0} Administration (58.8) (58.7} (59.9} (66.3} (78.5} Depreciation & Amortization (25.7} (26.3} (33.7} (40.4} (36.7} EBIT 66.2 43.6 50.0 56.9 73.1 Interest Income (Expense) (34.3) (33.4} (31.5} (38.2} (38.7} Pretax Income 31.9 10.2 18.5 18.7 34.4 Income Tax (11.2} (3.6} (6.5} (6.5} (12.0} Net Income 20.7 6.6 12.0 12.2 22.4 Shares Outstanding {millions} 56 56 56 56 56 Earnings per Share $0.37 $0.12 $0.21 $0.22 $0.40 Balance Sheet 2014 2015 2016 2017 2018 Assets Cash 50.4 72.6 93.9 83.7 87.2 Accounts Receivable 89.4 71.4 70.9 77.4 87.6 Inventory 32.8 30.2 26.7 32.3 36.5 Total CurrentAssets 172.6 174.2 191.5 193.4 211.3 Net Property, Plant 8 Equipment 250.2 244.2 310.3 343.1 351.8 10 Goodwill 8 Intangibles 358.2 358.2 358.2 358.2 358.2 Total Assets ?81.0 ??8.8 880.0 894.? 921.3 Liabilities 8 Stockholders' Equity Accounts Payable 19.3 19.? 23.? 28.3 33.8 Accrued Compensation 8.? ?.2 8.8 8.3 8.? Total Current Liabilities 28.0 28.9 30.3 38.8 42.3 LongTerm Debt 503.5 503.5 5?8.8 804.1 804.1 Total Liabilities 529.5 530.4 808.9 840.? 848.4 Stockholders Equity 251.5 248.2 251.1 254.0 274.9 Total Liabilities 3. Stockholders ?81.0 ??8.8 880.0 894.? 921.3 Equity Statement of Cash Flows 2014 2015 2018 201? 2010 Net Income 20.? 8.8 12.0 12.2 22.4 Depreciation 8Amortization 25.? 28.3 33.? 40.4 38.? Change in Accounts Receivable 3.9 18.0 0.5 (8.5} (10.2} Change in Inventory {2.9) 2.8 3.5 (5.8} (4.2} Change in Pay. 8Accrued lComp. 2.4 0.9 3.4 8.3 5.? Cash from Operations 49.8 54.4 53.1 48.8 50.4 Capital Expenditures (25.8} (28.0} (100.?} (?8.3} (39.8} Cash from Investing Actiy. (25.8} (28.0} (100.?} (?8.3} (39.8} Dividends Paid {8.2} (8.2} (8.2} (8.2} (?.1} Sale (or Purchase} of Stock - - - Debt Issuance (Pay Down} ?5.1 25.5 - \f

Step by Step Solution

There are 3 Steps involved in it

1 Expert Approved Answer
Step: 1 Unlock blur-text-image
Question Has Been Solved by an Expert!

Get step-by-step solutions from verified subject matter experts

Step: 2 Unlock
Step: 3 Unlock

Students Have Also Explored These Related Accounting Questions!