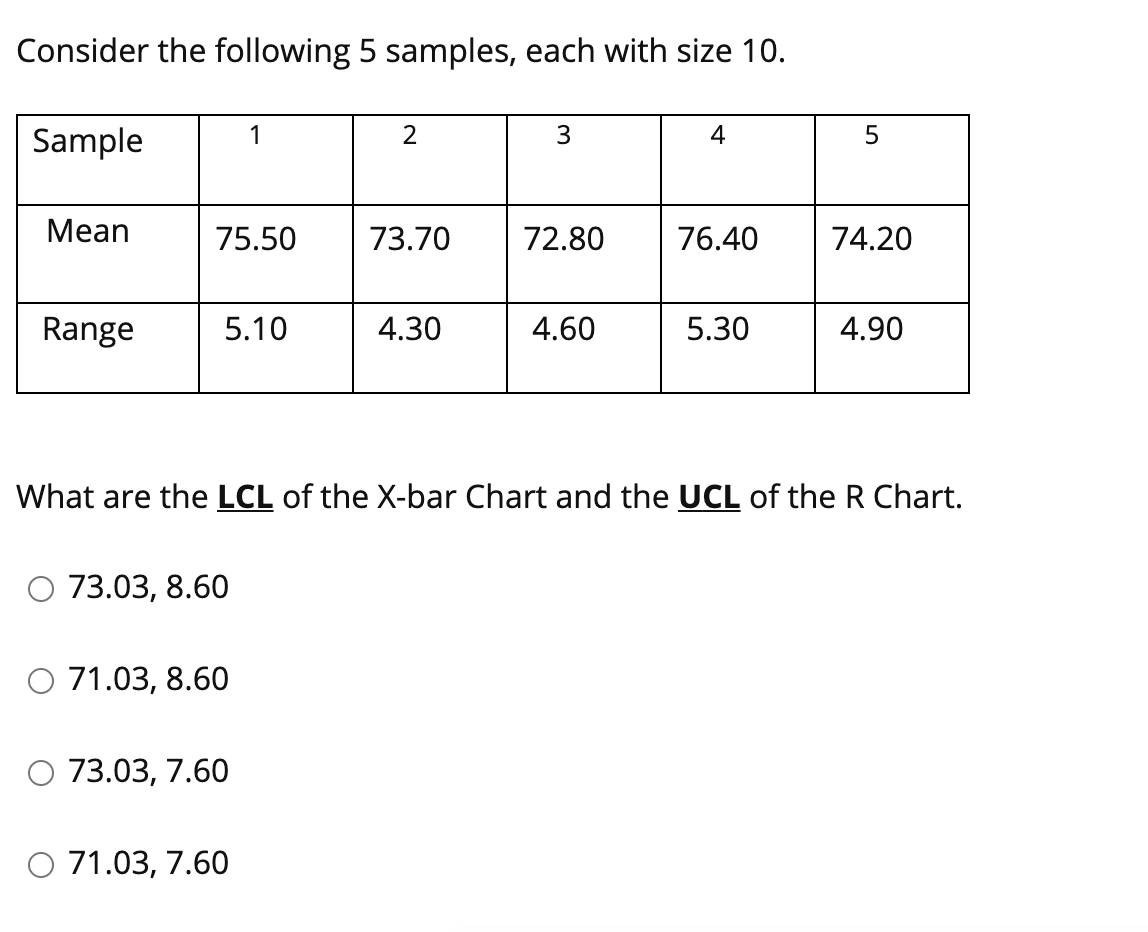
Question: Consider the following 5 samples, each with size 10. 1 Sample 2 3 4 5 Mean 75.50 73.70 72.80 76.40 74.20 Range 5.10 4.30 4.60

Consider the following 5 samples, each with size

Consider the following 5 samples, each with size 10. 1 Sample 2 3 4 5 Mean 75.50 73.70 72.80 76.40 74.20 Range 5.10 4.30 4.60 5.30 4.90 What are the LCL of the X-bar Chart and the UCL of the R Chart. 73.03, 8.60 71.03, 8.60 73.03, 7.60 0 71.03, 7.60

Step by Step Solution

There are 3 Steps involved in it

1 Expert Approved Answer
Step: 1 Unlock blur-text-image
Question Has Been Solved by an Expert!

Get step-by-step solutions from verified subject matter experts

Step: 2 Unlock
Step: 3 Unlock

Students Have Also Explored These Related General Management Questions!