

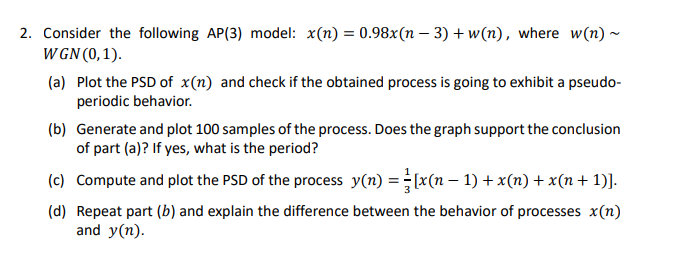
Question: Consider the following A P ( 3 ) model: x ( n ) = 0 . 9 8 x ( n - 3 ) +
Consider the following model: where
a Plot the PSD of and check if the obtained process is going to exhibit a pseudo
periodic behavior.
b Generate and plot samples of the process. Does the graph support the conclusion
of part a If yes, what is the period?
c Compute and plot the PSD of the process
d Repeat part b and explain the difference between the behavior of processes
and
Use Matlab for everything with explanation please!
Step by Step Solution
There are 3 Steps involved in it
1 Expert Approved Answer
Step: 1 Unlock

Question Has Been Solved by an Expert!
Get step-by-step solutions from verified subject matter experts
Step: 2 Unlock
Step: 3 Unlock