

Question: Consider the following box and whisker plot. Match the letters with the values. 1.X 2.Z 3.Y A. Max 3- Q1 C. Mean D. Left Pivot
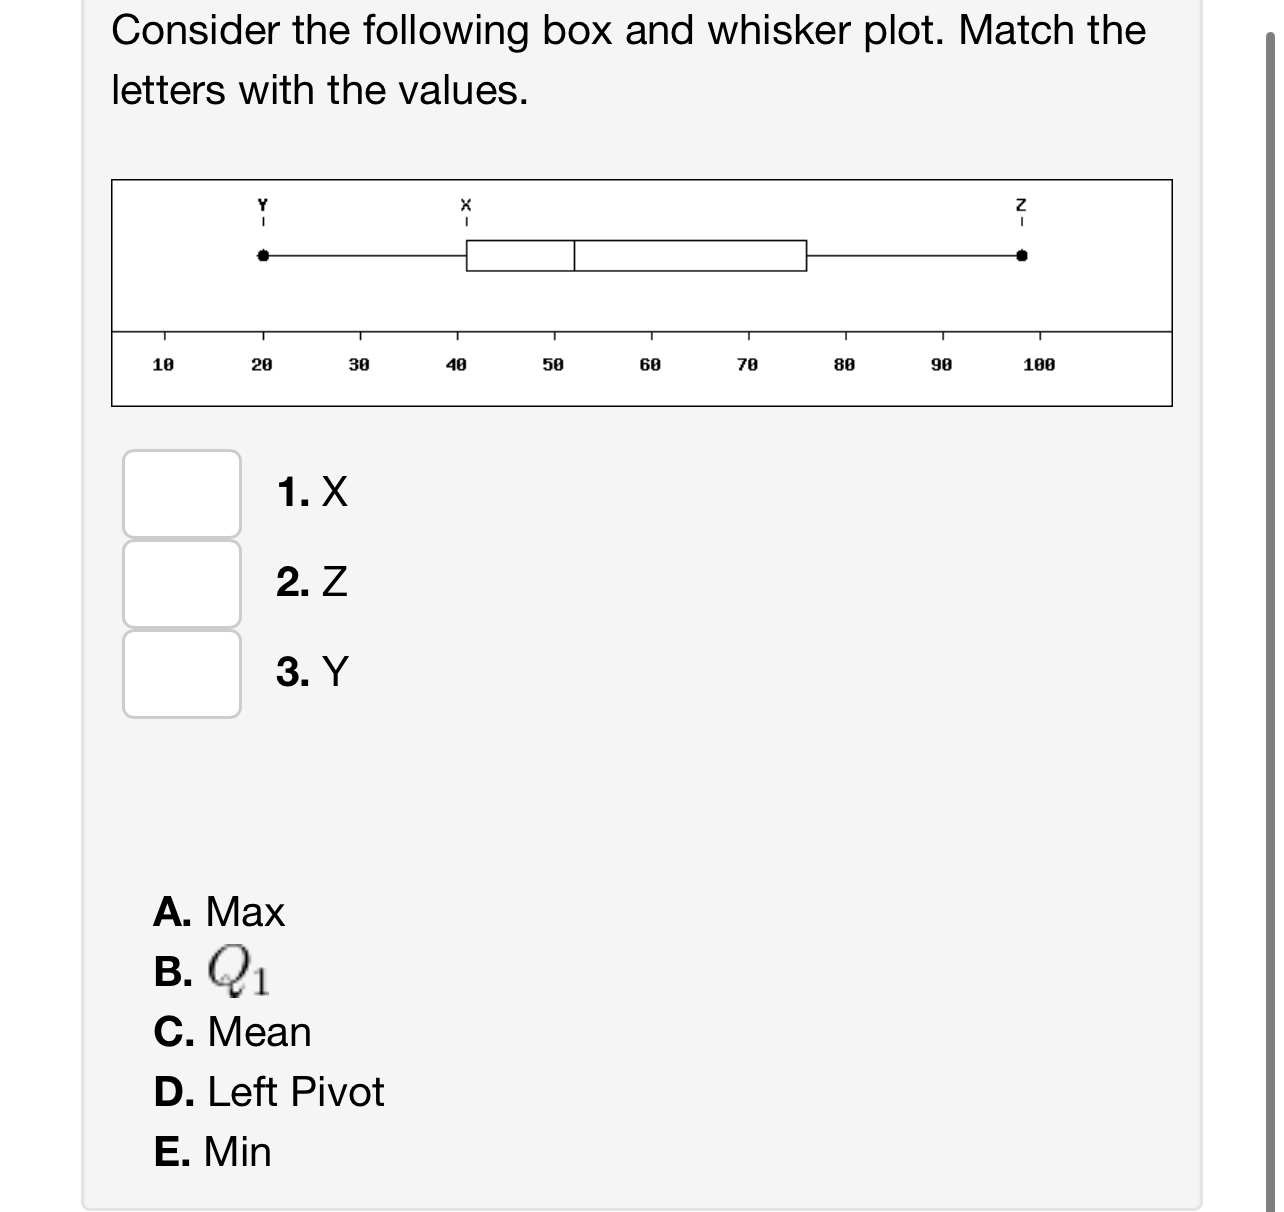
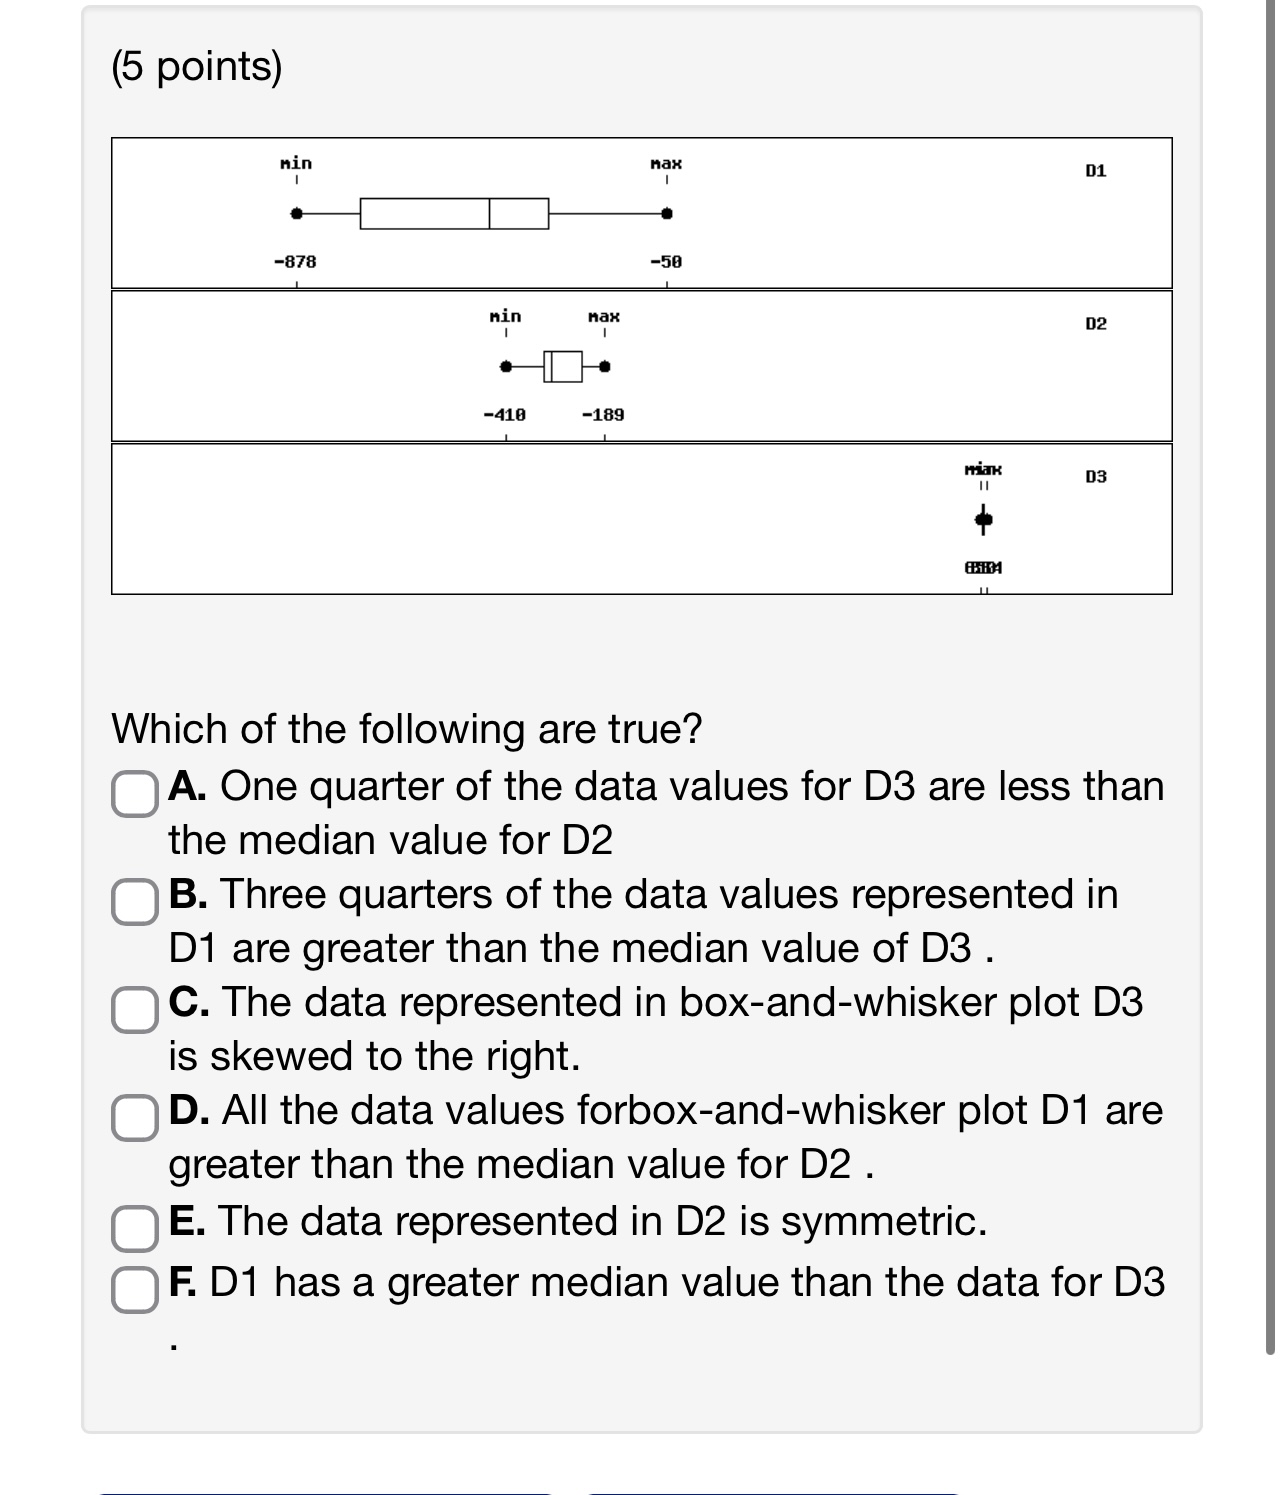


Consider the following box and whisker plot. Match the letters with the values. 1.X 2.Z 3.Y A. Max 3- Q1 C. Mean D. Left Pivot E. Min Which of the following are true? O A. One quarter of the data values for D3 are less than the median value for D2 O B. Three quarters of the data values represented in D1 are greater than the median value of D3 . C] C. The data represented in box-and-whisker plot D3 is skewed to the right. O D. All the data values forboxandwhisker plot D1 are greater than the median value for D2 . O E. The data represented in D2 is symmetric. O F. D1 has a greater median value than the data for D3
Step by Step Solution
There are 3 Steps involved in it
1 Expert Approved Answer
Step: 1 Unlock

Question Has Been Solved by an Expert!
Get step-by-step solutions from verified subject matter experts
Step: 2 Unlock
Step: 3 Unlock