

Question: Consider the following case study: ABC Electronics is a South African manufacturer of electronic equipment. The company has a single manufacturing facility in Pretoria, South
Consider the following case study: ABC Electronics is a South African manufacturer of electronic equipment. The company has a single manufacturing facility in Pretoria, South Africa. ABC distributes its products through five regional warehouses located in Cape Town, Bloemfontein, Durban, Polokwane and East London. In the current distribution system, South Africa is partitioned into five major markets, each of which is served by a single regional warehouse. Customers, typically retail outlets, receive items directly from the regional warehouse in their market. That is, in the current distribution system, each customer is assigned to a single market and receives deliveries from one regional warehouse. The warehouses receive items from the manufacturing facility. Typically, it takes about two weeks to satisfy an order placed by any of the regional warehouses. Currently, ABC provides their customers with a service level of about 90 percent. In recent years, ABC has seen a significant increase in competition and huge pressure from their customers to improve the service level and reduce costs. To improve the service level and reduce costs, ABC would like to consider an alternative distribution
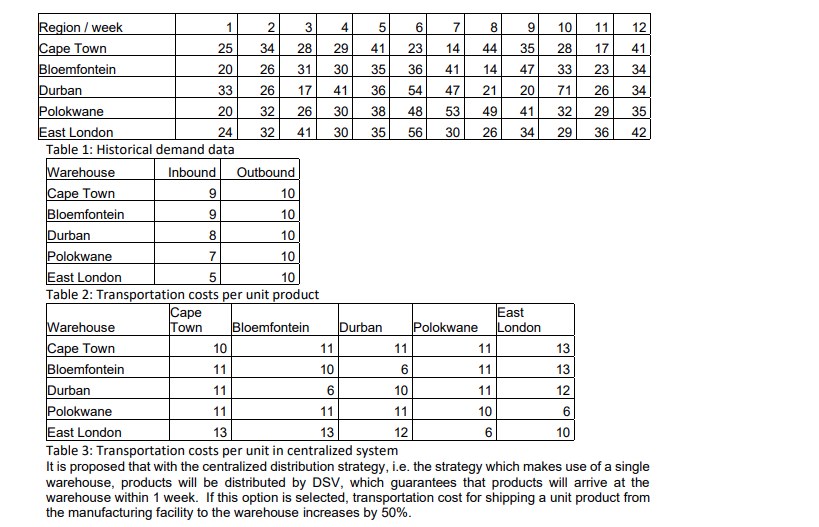
strategy in which the five regional warehouses are replaced with a single, central warehouse that will be in charge of all customer orders. This warehouse should be one of the existing warehouses. The company CEO insists that whatever distribution strategy is used, ABC will design the strategy so that service level is increased to 95 percent. (Z = 1.65) To perform a rigorous analysis, you have identified a typical product, Product A. Table 1 provides historical data and includes weekly demand for this product for the last 12 weeks in each market areas. An order (placed by a warehouse to the factory) costs R20 000 (per order), and holding inventory costs R3.00 per unit per week. In the current distribution system, the cost of transporting a product from the manufacturing facility to a warehouse is given in Table 2 (see the column Inbound) Table 2 also provides information about transportation cost per unit from each warehouse to the stores in its market area (see the column Outbound). Finally, Table 3 provides information about transportation costs per unit product from each existing regional warehouse to all the other market areas, assuming this regional warehouse becomes the central warehouse. Suppose you are to compare the two systems for Product A only, work with a z value to two decimal places and compare the proposed decentralized system with the new proposed centralized system.
The answers are as follows:
I just dont know the method?
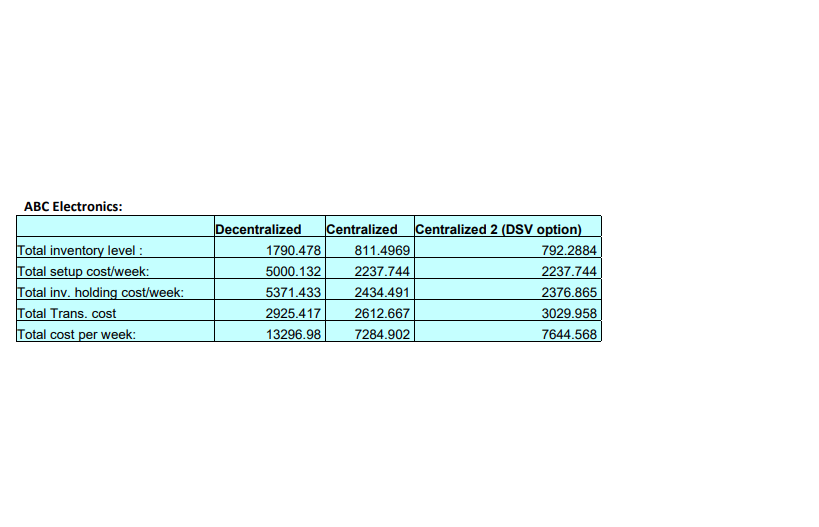
4 25 41 32 30 Region /week 1 2 3 4 5 6 7 8 9 10 11 12 Cape Town 34 28 29 41 23 14 44 35 28 17 Bloemfontein 20 26 31 30 35 36 41 14 47 33 23 34 Durban 33 26 17 41 36 54 47 21 20 71 26 34 Polokwane 20 32 26 30 38 48 53 49 41 32 29 35 East London 24 41 35 56 30 26 34 29 36 42 Table 1: Historical demand data Warehouse Inbound Outbound Cape Town 9 10 Bloemfontein 9 10 Durban 8 10 Polokwane 7 10 East London 5 10 Table 2: Transportation costs per unit product Cape East Warehouse Town Bloemfontein Durban Polokwane London Cape Town 10 11 11 11 13 Bloemfontein 11 10 6 11 13 Durban 11 6 10 11 12 Polokwane 11 11 11 10 6 East London 13 13 12 6 10 Table 3: Transportation costs per unit in centralized system It is proposed that with the centralized distribution strategy, i.e. the strategy which makes use of a single warehouse, products will be distributed by DSV, which guarantees that products will arrive at the warehouse within 1 week. If this option is selected, transportation cost for shipping a unit product from the manufacturing facility to the warehouse increases by 50%. ABC Electronics: Total inventory level : Total setup cost/week: Total inv. holding cost/week: Total Trans. cost Total cost per week: Decentralized Centralized Centralized 2 (DSV option) 1790.478 811.4969 792.2884 5000.132 2237.744 2237.744 5371.433 2434.491 2376.865 2925.417 2612.667 3029.958 13296.98 7284.902 7644.568 4 25 41 32 30 Region /week 1 2 3 4 5 6 7 8 9 10 11 12 Cape Town 34 28 29 41 23 14 44 35 28 17 Bloemfontein 20 26 31 30 35 36 41 14 47 33 23 34 Durban 33 26 17 41 36 54 47 21 20 71 26 34 Polokwane 20 32 26 30 38 48 53 49 41 32 29 35 East London 24 41 35 56 30 26 34 29 36 42 Table 1: Historical demand data Warehouse Inbound Outbound Cape Town 9 10 Bloemfontein 9 10 Durban 8 10 Polokwane 7 10 East London 5 10 Table 2: Transportation costs per unit product Cape East Warehouse Town Bloemfontein Durban Polokwane London Cape Town 10 11 11 11 13 Bloemfontein 11 10 6 11 13 Durban 11 6 10 11 12 Polokwane 11 11 11 10 6 East London 13 13 12 6 10 Table 3: Transportation costs per unit in centralized system It is proposed that with the centralized distribution strategy, i.e. the strategy which makes use of a single warehouse, products will be distributed by DSV, which guarantees that products will arrive at the warehouse within 1 week. If this option is selected, transportation cost for shipping a unit product from the manufacturing facility to the warehouse increases by 50%. ABC Electronics: Total inventory level : Total setup cost/week: Total inv. holding cost/week: Total Trans. cost Total cost per week: Decentralized Centralized Centralized 2 (DSV option) 1790.478 811.4969 792.2884 5000.132 2237.744 2237.744 5371.433 2434.491 2376.865 2925.417 2612.667 3029.958 13296.98 7284.902 7644.568
Step by Step Solution
There are 3 Steps involved in it

Get step-by-step solutions from verified subject matter experts