

Question: Consider the following chart. The (approximate) long run equilibrium is Select one: A price level of 105 and a GDP level of 1.0 A price
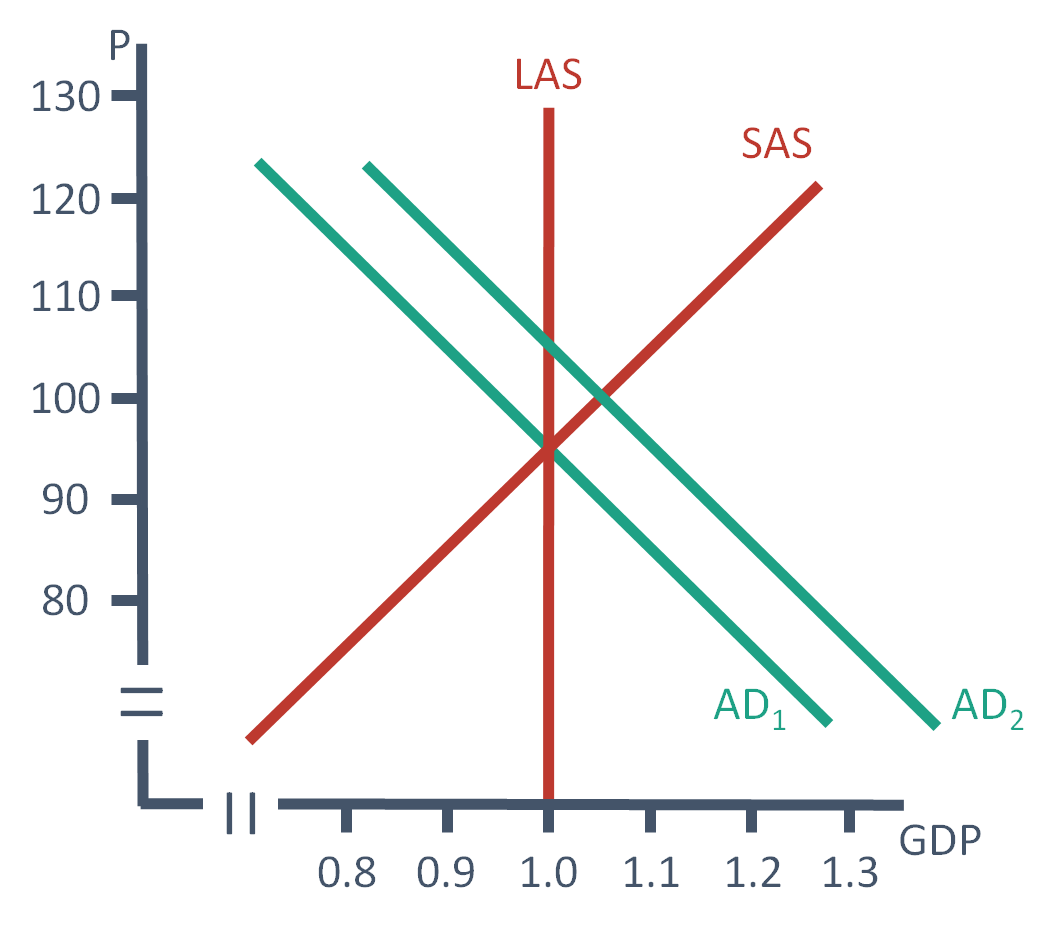
Consider the following chart.
The (approximate) long run equilibrium is
Select one:
A price level of 105 and a GDP level of 1.0
A price level of 100 and a GDP level of 1.0
A price level of 95 and a GDP level of 1.0
A price level of 95 and a GDP level of 1.1
Step by Step Solution
There are 3 Steps involved in it
1 Expert Approved Answer
Step: 1 Unlock

Question Has Been Solved by an Expert!
Get step-by-step solutions from verified subject matter experts
Step: 2 Unlock
Step: 3 Unlock