

Question: Consider the following data: 26 48 50 40 44 33 26 47 49 26 39 22 25 26 31 29 51 28 27 49 51
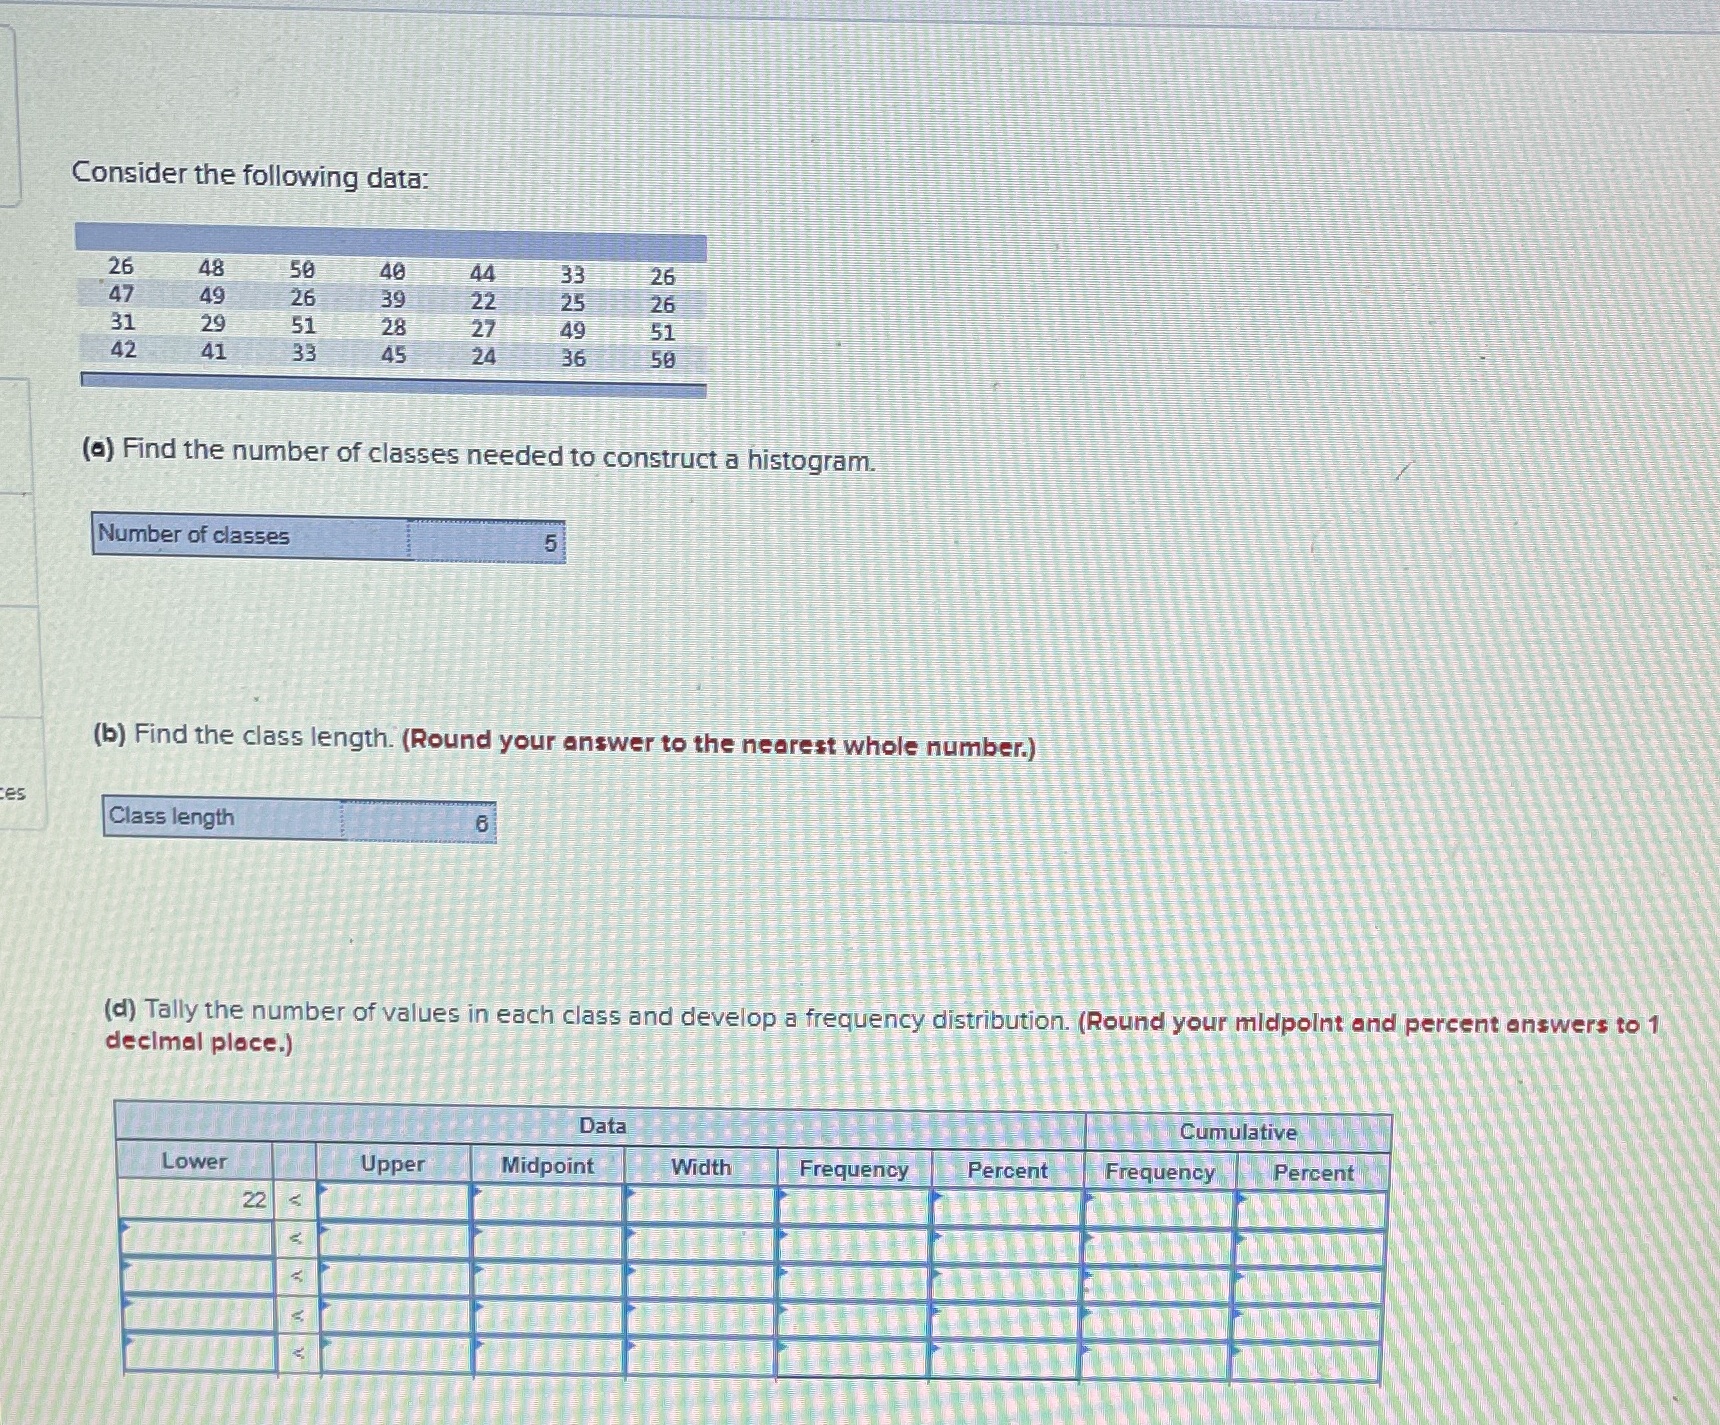
Consider the following data: 26 48 50 40 44 33 26 47 49 26 39 22 25 26 31 29 51 28 27 49 51 42 41 33 45 24 36 50 (a) Find the number of classes needed to construct a histogram. Number of classes (b) Find the class length. (Round your answer to the nearest whole number.) :es Class length (d) Tally the number of values in each class and develop a frequency distribution. (Round your midpoint and percent answers to 1 decimal place.) Data Cumulative Midpoint Width Frequency Frequency Percent Lower Upper Percent 22
Step by Step Solution
There are 3 Steps involved in it
1 Expert Approved Answer
Step: 1 Unlock

Question Has Been Solved by an Expert!
Get step-by-step solutions from verified subject matter experts
Step: 2 Unlock
Step: 3 Unlock