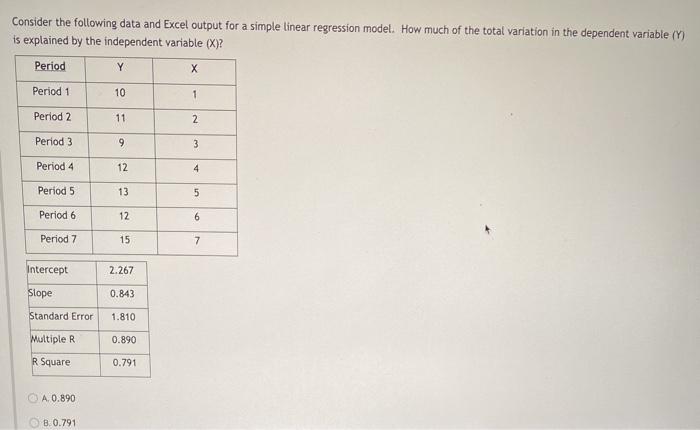
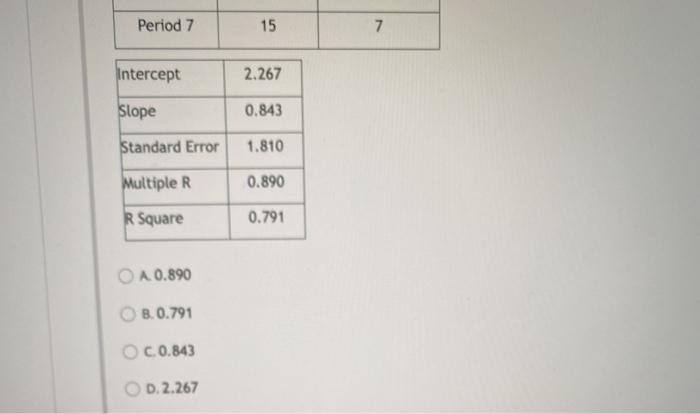
Question: Consider the following data and Excel output for a simple linear regression model. How much of the total variation in the dependent variable (Y) is

Consider the following data and Excel output for
Consider the following data and Excel output for a simple linear regression model. How much of the total variation in the dependent variable (Y) is explained by the independent variable (X)? Period Y Period 1 10 1 Period 2 11 2 Period 3 9 3 Period 4 12 4 Period 5 13 5 Period 6 12 6 Period 7 15 7 Intercept 2.267 Slope 0.843 Standard Error 1.810 Multiple R 0.890 R Square 0.791 A. 0.890 B. 0.791 Period 7 15 7 Intercept 2.267 Slope 0.843 Standard Error 1.810 Multiple R 0.890 R Square 0.791 O A 0.890 8.0.791 OC. 0.843 OD. 2.267

Step by Step Solution

There are 3 Steps involved in it

1 Expert Approved Answer
Step: 1 Unlock blur-text-image
Question Has Been Solved by an Expert!

Get step-by-step solutions from verified subject matter experts

Step: 2 Unlock
Step: 3 Unlock

Students Have Also Explored These Related General Management Questions!