

Question: Please solve and explain Consider the following data and Excel output for a simple linear regression model. How much of the total variation in the
Please solve and explain
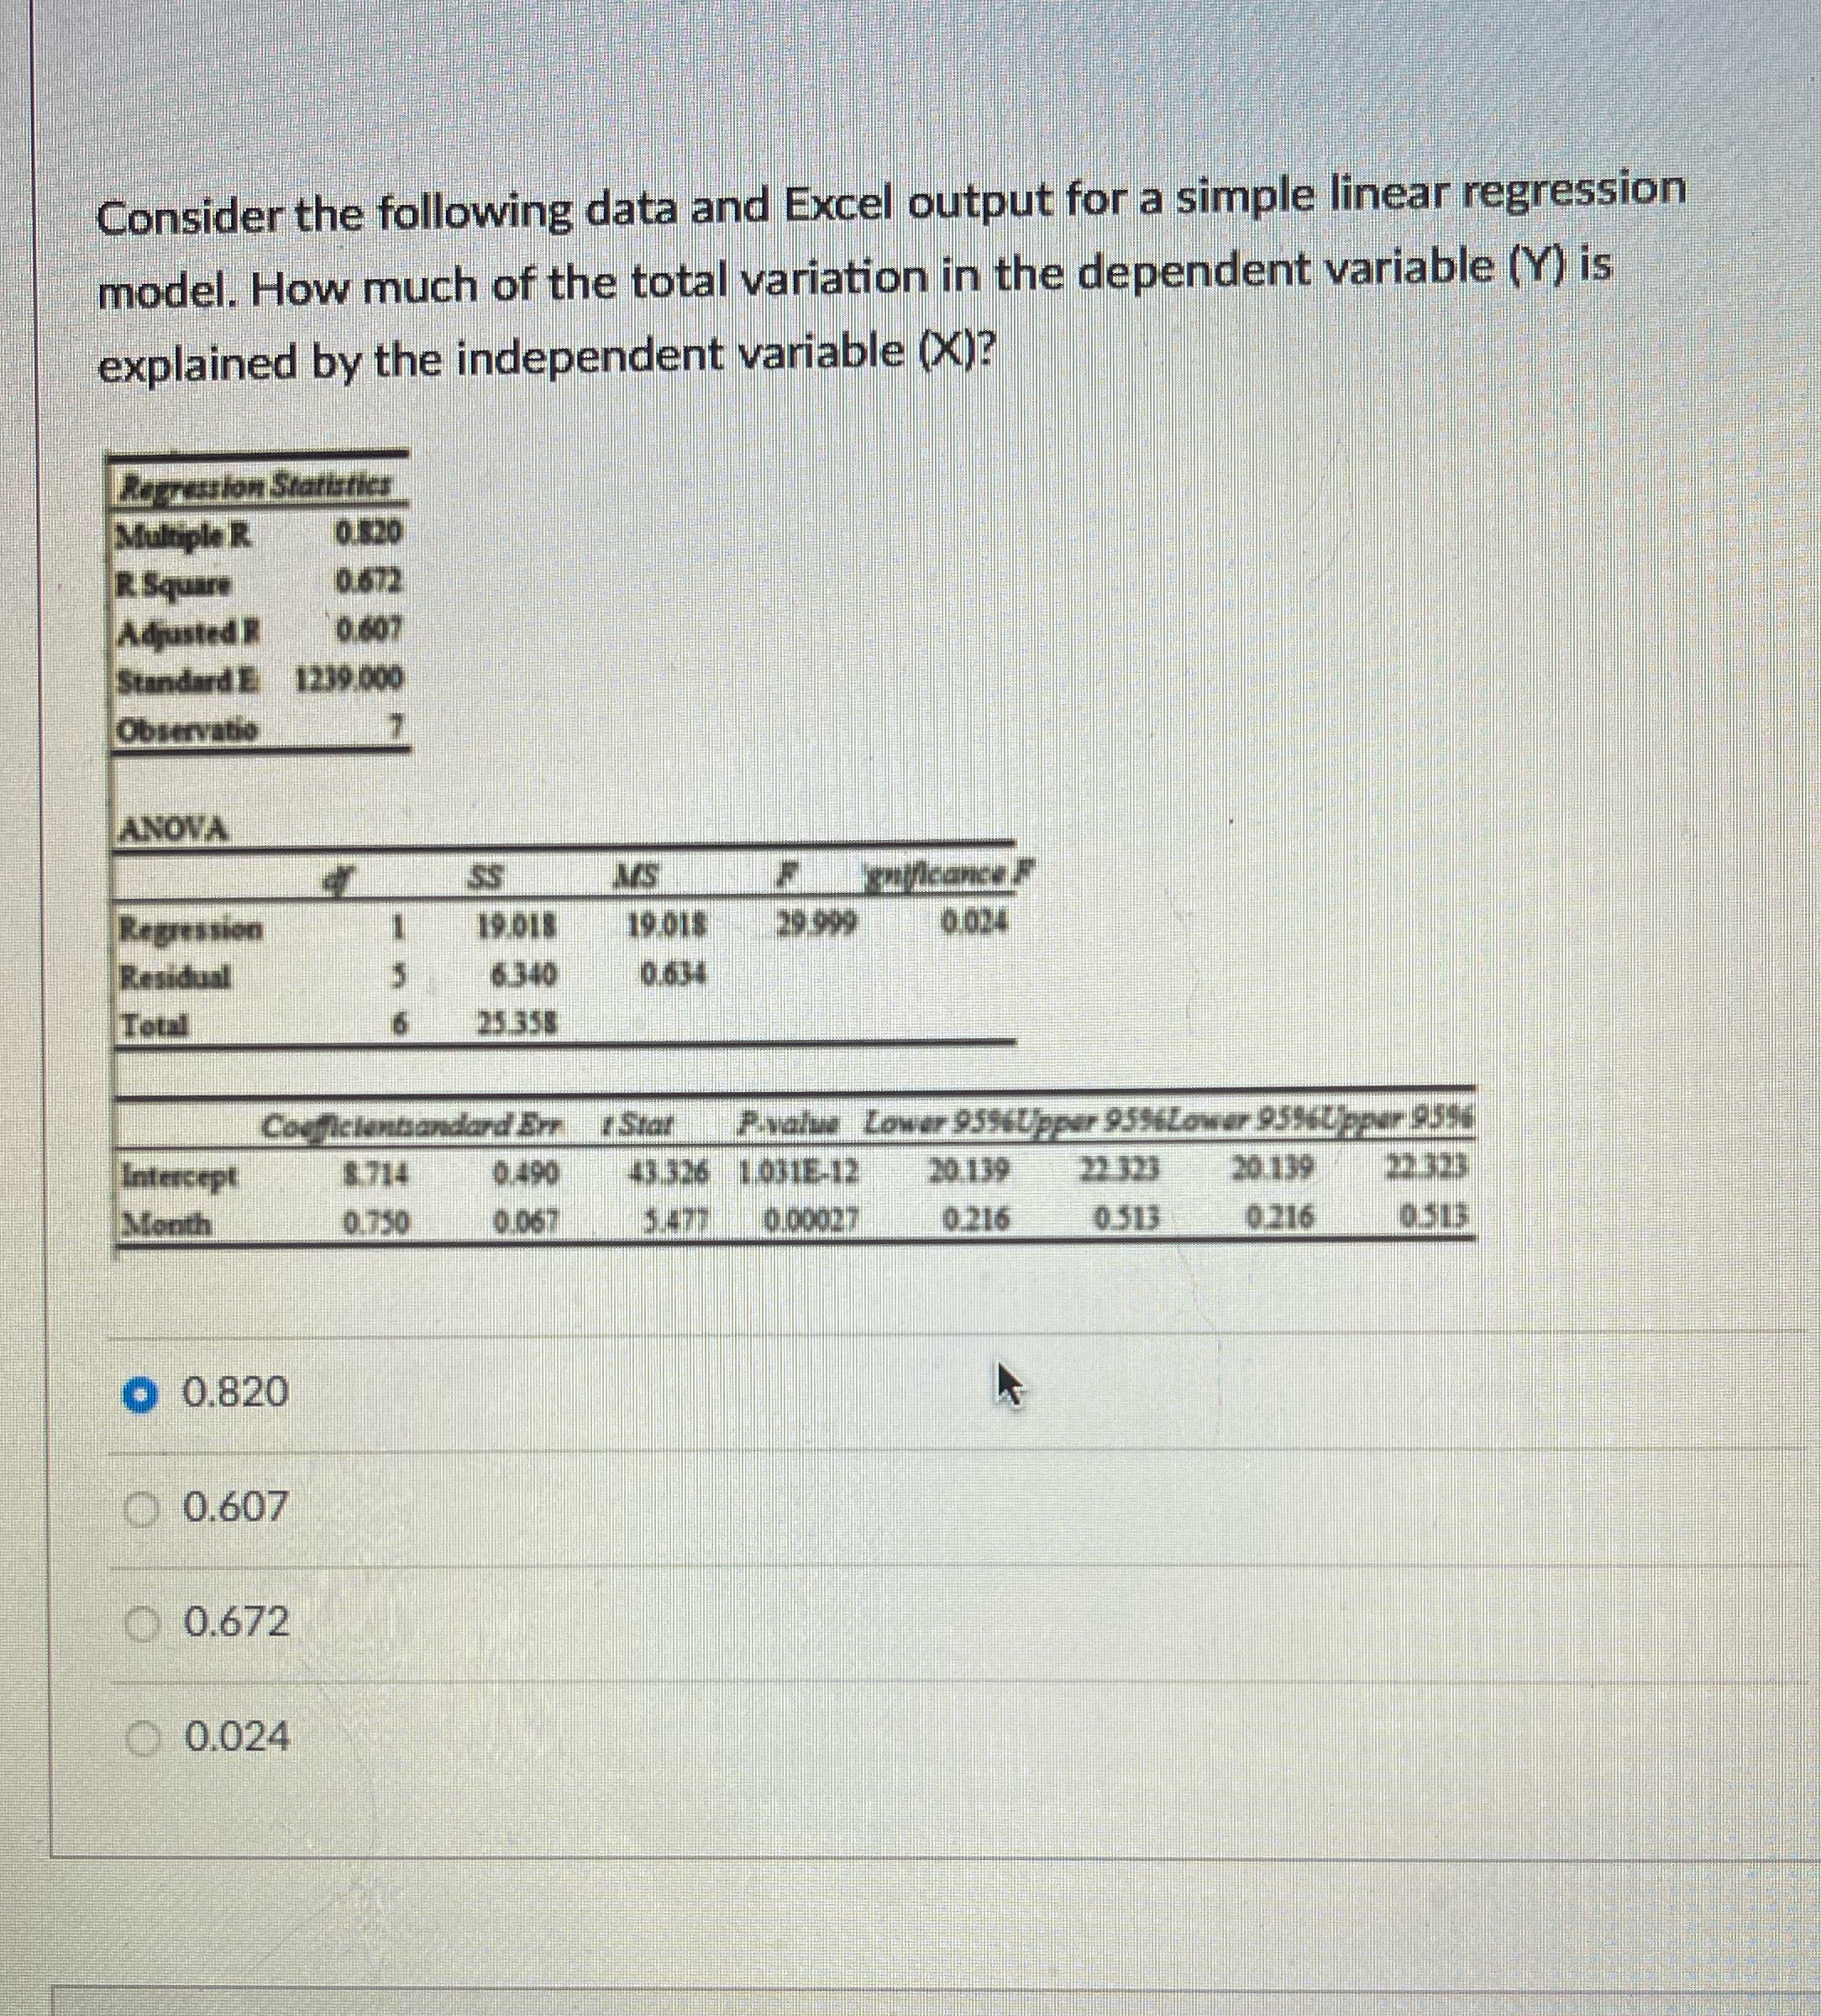
Consider the following data and Excel output for a simple linear regression model. How much of the total variation in the dependent variable (Y) is explained by the independent variable (()? assion Statistics SS AIS 19.018 19.018 29 999 0.024 6.340 0.634 25.358 Coofficiantsand Hard Err : Stat Rivalus Lower 95%%Upper 95%flower 959095% 8.714 0.490 43.326 10318-12 20.139 22 323 20.139 22 323 0.750 0.067 3.477 0.00027 0.216 0513 0.216 0313 0.820 0.607 0.672 0.024
Step by Step Solution
There are 3 Steps involved in it
1 Expert Approved Answer
Step: 1 Unlock

Question Has Been Solved by an Expert!
Get step-by-step solutions from verified subject matter experts
Step: 2 Unlock
Step: 3 Unlock