

Question: Consider the following data for two variables, x and y. (a) Compute the standardized residuals for these data. (Round your answers to two decimal places.)
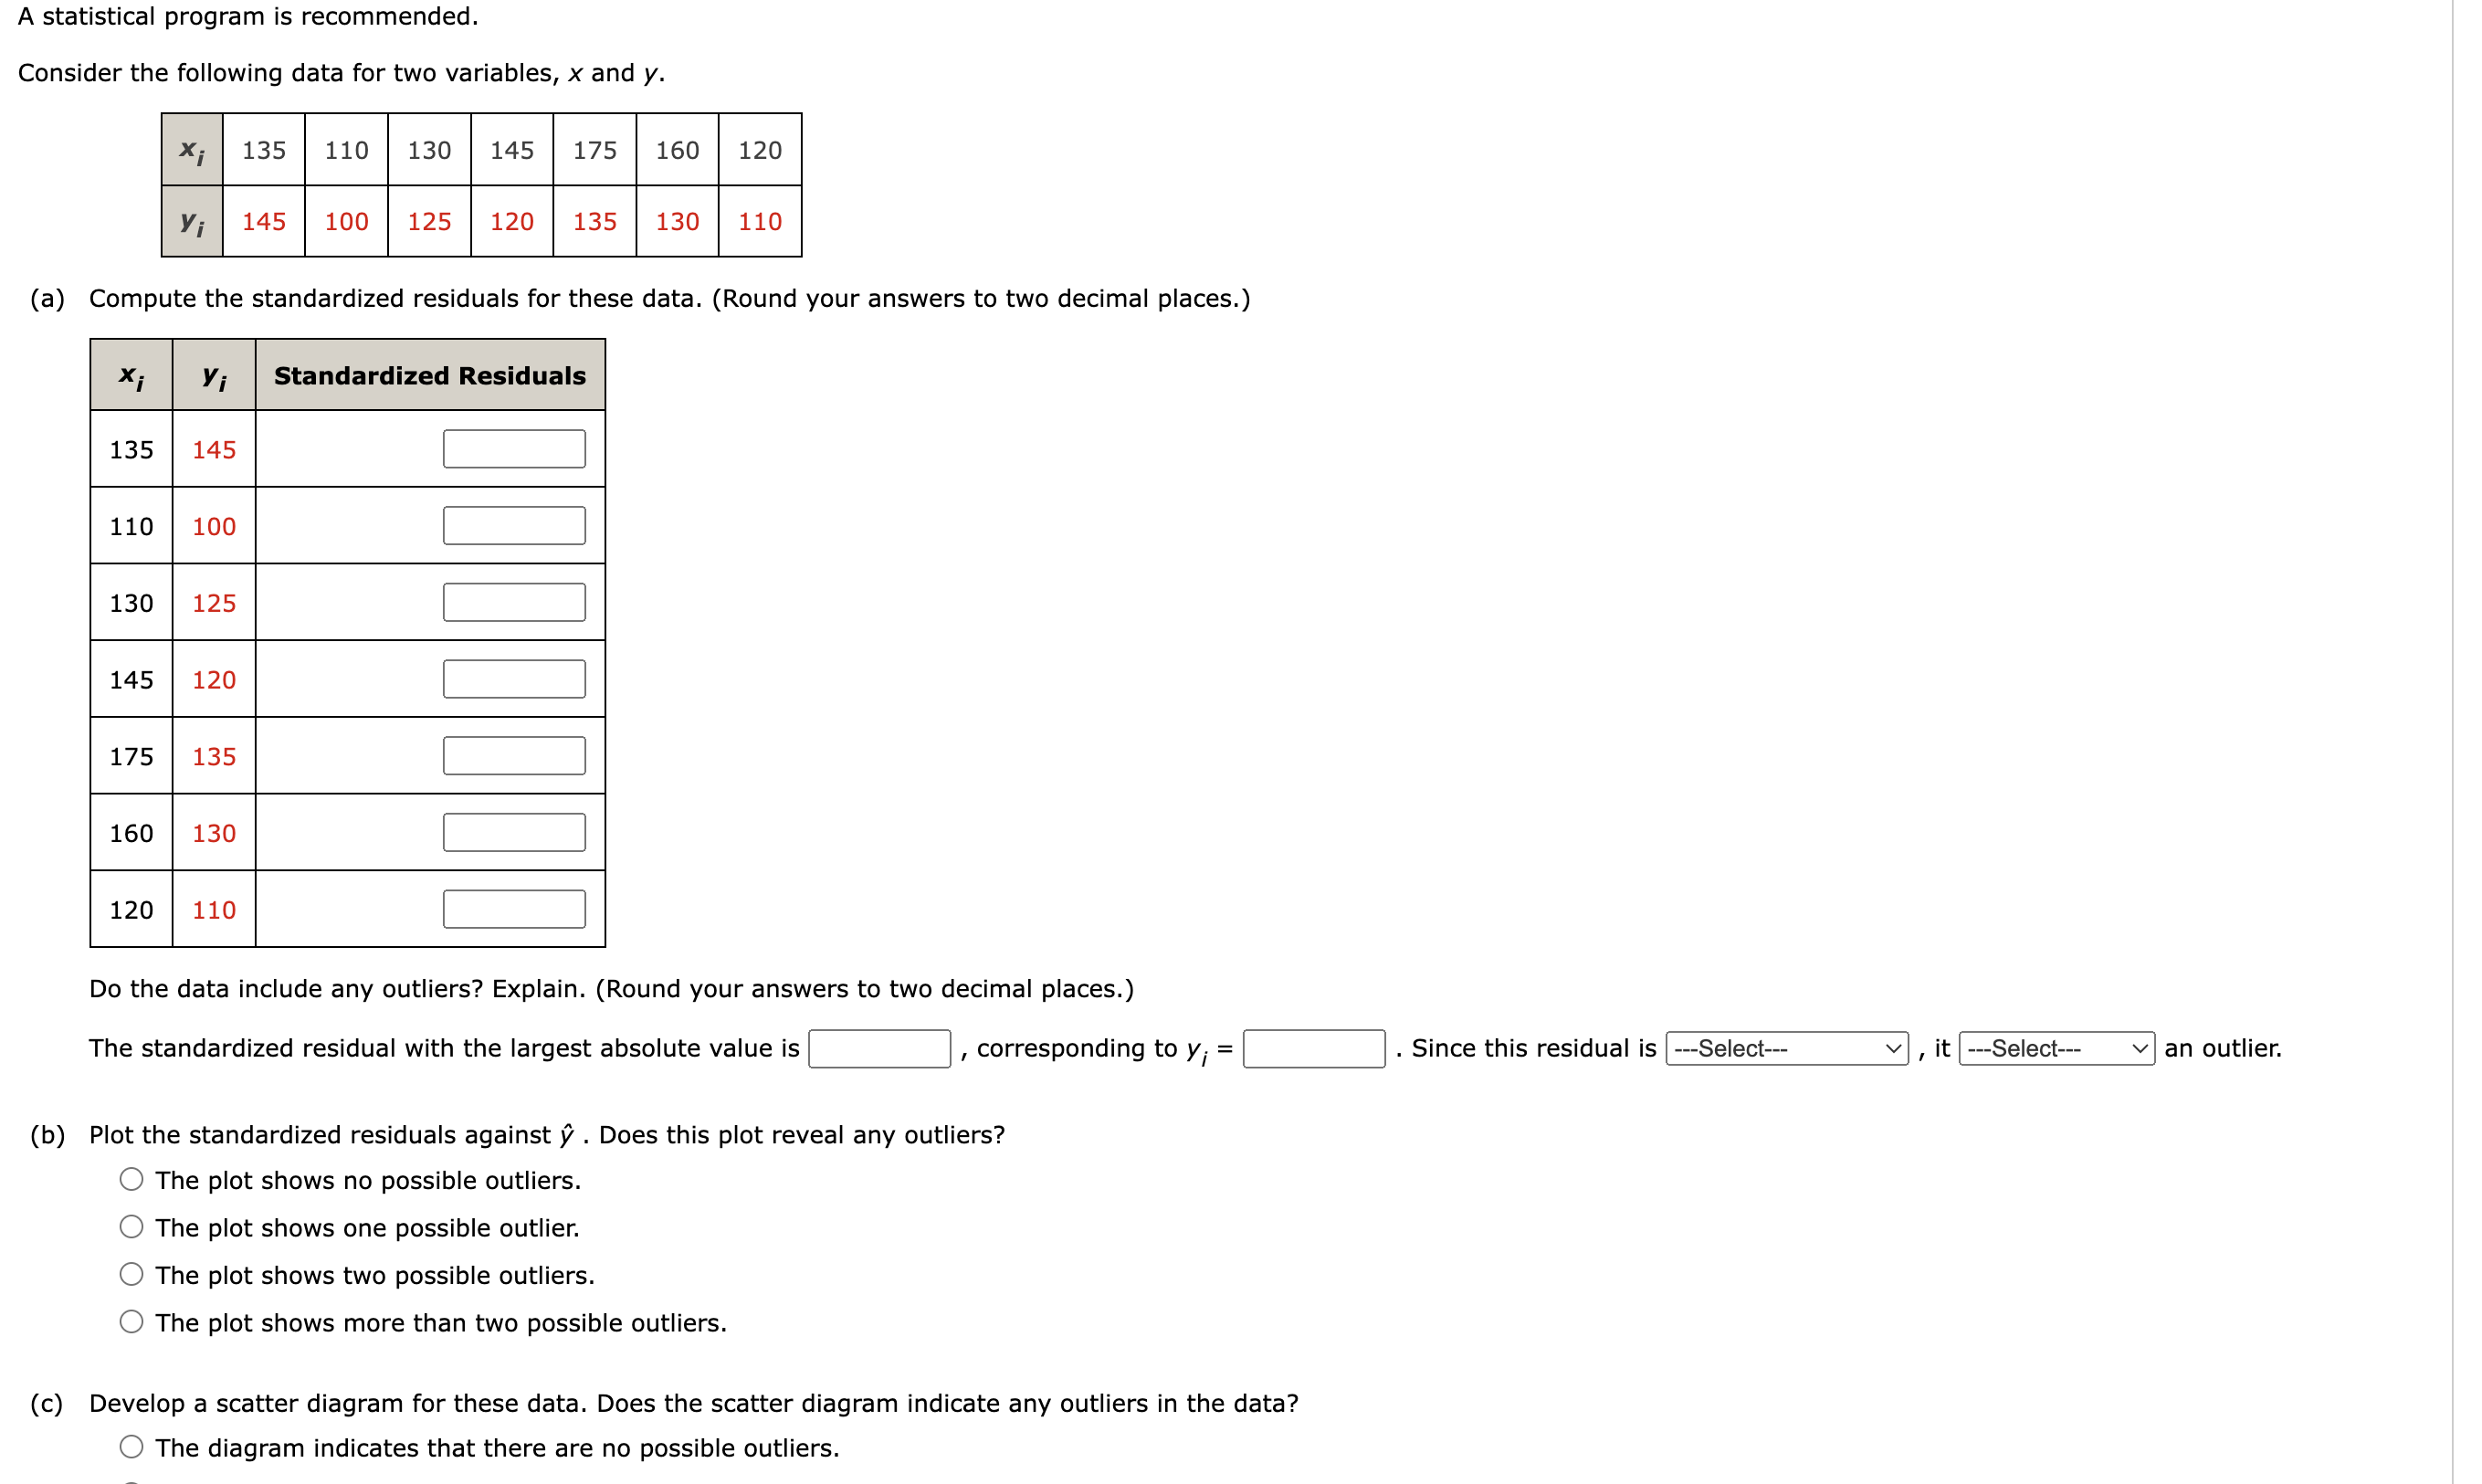
Consider the following data for two variables, x and y. (a) Compute the standardized residuals for these data. (Round your answers to two decimal places.) Do the data include any outliers? Explain. (Round your answers to two decimal places.) The standardized residual with the largest absolute value is , corresponding to yi= . Since this residual is , it an outlier. (b) Plot the standardized residuals against y^. Does this plot reveal any outliers? The plot shows no possible outliers. The plot shows one possible outlier. The plot shows two possible outliers. The plot shows more than two possible outliers. (c) Develop a scatter diagram for these data. Does the scatter diagram indicate any outliers in the data? The diagram indicates that there are no possible outliers
Step by Step Solution
There are 3 Steps involved in it

Get step-by-step solutions from verified subject matter experts