

Question: Consider the following data on the time spent studying for the math exam and math grades of 6 students Time spent 10 2 5
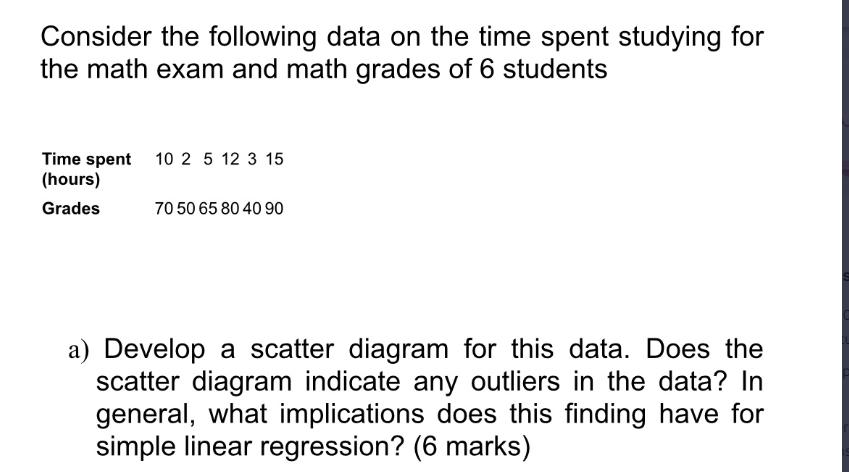
Consider the following data on the time spent studying for the math exam and math grades of 6 students Time spent 10 2 5 12 3 15 (hours) Grades 70 50 65 80 40 90 a) Develop a scatter diagram for this data. Does the scatter diagram indicate any outliers in the data? In general, what implications does this finding have for simple linear regression? (6 marks)
Step by Step Solution
3.35 Rating (161 Votes )
There are 3 Steps involved in it
plot the time spent studying on the xaxis and the grades on the yaxis The resulting scatter plot is ... View full answer

Get step-by-step solutions from verified subject matter experts