

Question: Consider the following data set that contains information about a sample of ten vehicles that recorded their gross weight and their fuel efficiency as
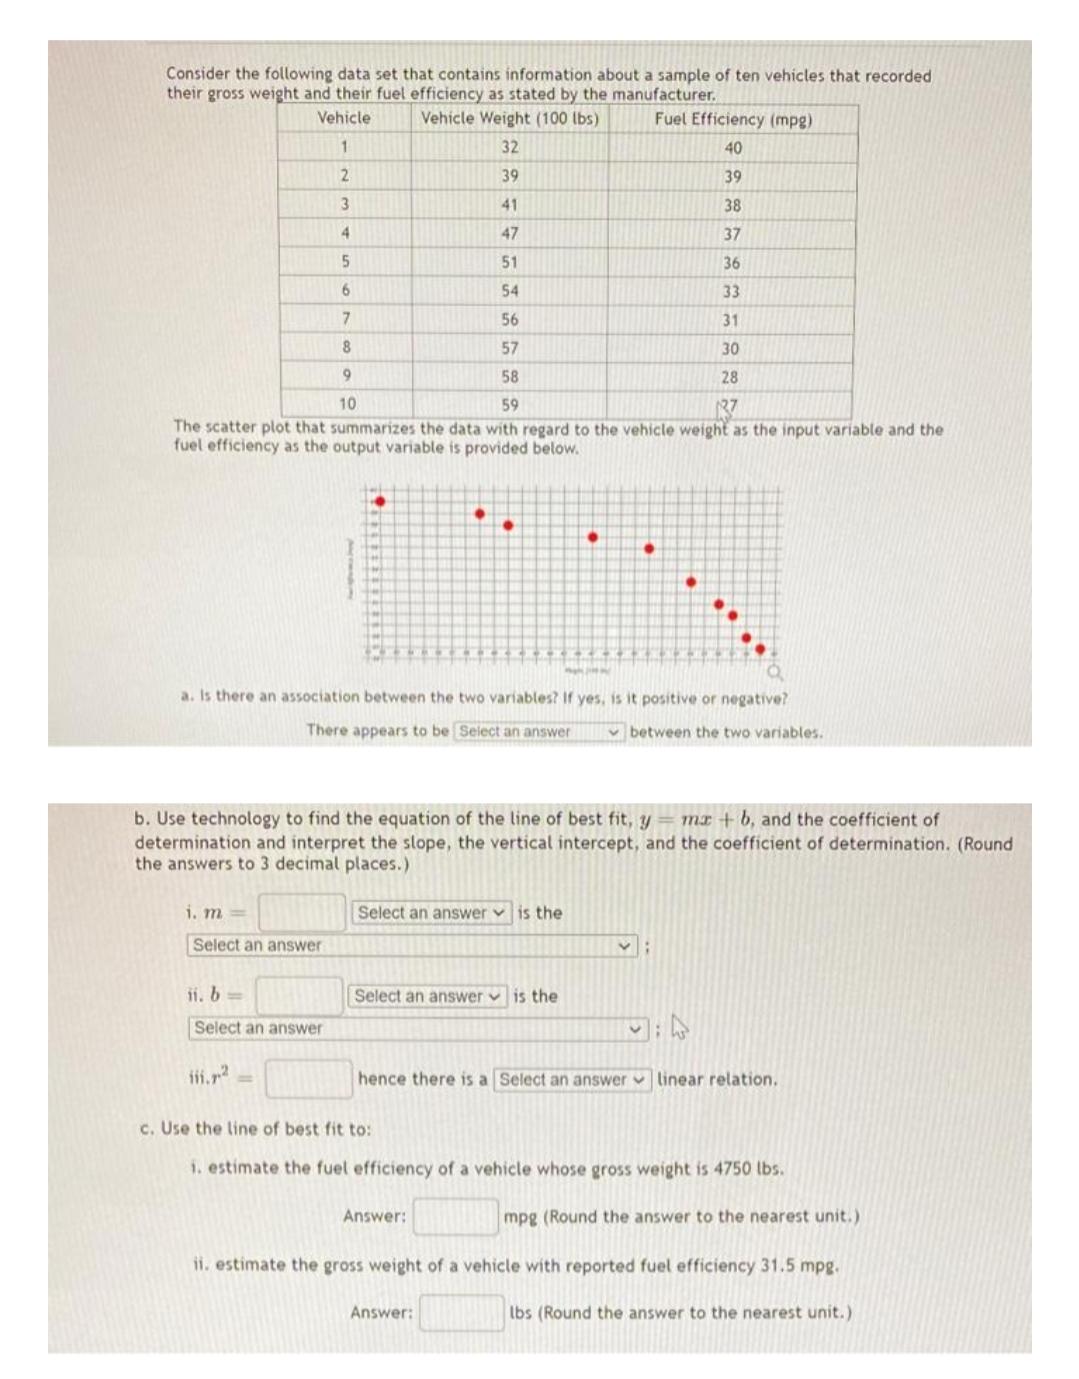
Consider the following data set that contains information about a sample of ten vehicles that recorded their gross weight and their fuel efficiency as stated by the manufacturer. Vehicle Vehicle Weight (100 lbs) Fuel Efficiency (mpg) 32 40 2. 39 39 3. 41 38 4. 47 37 51 36 6. 54 33 56 31 57 30 9. 58 28 10 59 37 The scatter plot that summarizes the data with regard to the vehicle weight as the input variable and the fuel efficiency as the output variable is provided below. a. Is there an association between the two variables? If yes, is it positive or negative? There appears to be Select an answer v between the two variables. b. Use technology to find the equation of the line of best fit, y = mI + b, and the coefficient of determination and interpret the slope, the vertical intercept, and the coefficient of determination. (Round the answers to 3 decimal places.) i. m = Select an answer v is the Select an answer ii, b= Select an answer v is the Select an answer tii.r hence there is a Select an answer v linear relation. c. Use the line of best fit to: 1. estimate the fuel efficiency of a vehicle whose gross weight is 4750 lbs. Answer: mpg (Round the answer to the nearest unit.) ii. estimate the gross weight of a vehicle with reported fuel efficiency 31.5 mpg. Answer: Ibs (Round the answer to the nearest unit.)
Step by Step Solution
3.44 Rating (147 Votes )
There are 3 Steps involved in it
Answers a The... View full answer

Get step-by-step solutions from verified subject matter experts