

Question: Consider the following data set that contains information about the average price of a dozen eggs and gas price per gallon in ten randomly chosen
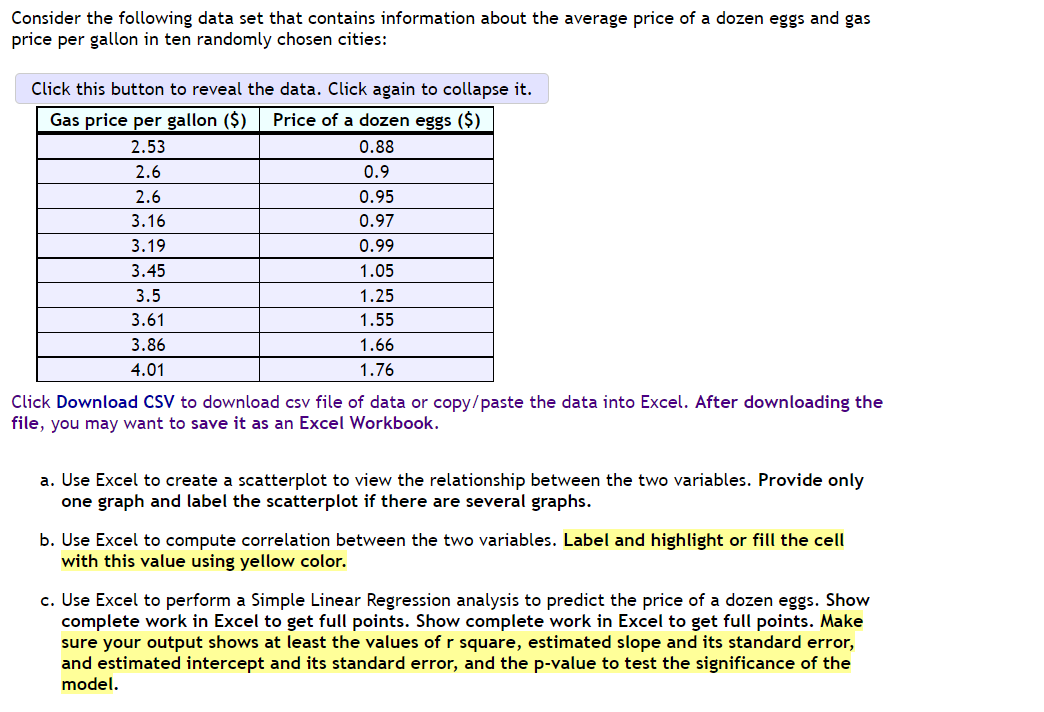
Consider the following data set that contains information about the average price of a dozen eggs and gas price per gallon in ten randomly chosen cities: Click this button to reveal the data. Click again to collapse it. Gas price per gallon ($) Price of a dozen eggs ($) 2.53 0.88 2.6 0.9 2.6 0.95 3.16 0.97 3.19 0.99 3.45 1.05 3.5 1.25 3.61 1.55 3.86 1.66 4.01 1.76 Click Download CSV to download csv file of data or copy/paste the data into Excel. After downloading the file, you may want to save it as an Excel Workbook. a. Use Excel to create a scatterplot to view the relationship between the two variables. Provide only one graph and label the scatterplot if there are several graphs. b. Use Excel to compute correlation between the two variables. Label and highlight or fill the cell with this value using yellow color. c. Use Excel to perform a Simple Linear Regression analysis to predict the price of a dozen eggs. Show complete work in Excel to get full points. Show complete work in Excel to get full points. Make sure your output shows at least the values of r square, estimated slope and its standard error, and estimated intercept and its standard error, and the p-value to test the significance of the model. Consider the following data set that contains information about the average price of a dozen eggs and gas price per gallon in ten randomly chosen cities: Click this button to reveal the data. Click again to collapse it. Gas price per gallon ($) Price of a dozen eggs ($) 2.53 0.88 2.6 0.9 2.6 0.95 3.16 0.97 3.19 0.99 3.45 1.05 3.5 1.25 3.61 1.55 3.86 1.66 4.01 1.76 Click Download CSV to download csv file of data or copy/paste the data into Excel. After downloading the file, you may want to save it as an Excel Workbook. a. Use Excel to create a scatterplot to view the relationship between the two variables. Provide only one graph and label the scatterplot if there are several graphs. b. Use Excel to compute correlation between the two variables. Label and highlight or fill the cell with this value using yellow color. c. Use Excel to perform a Simple Linear Regression analysis to predict the price of a dozen eggs. Show complete work in Excel to get full points. Show complete work in Excel to get full points. Make sure your output shows at least the values of r square, estimated slope and its standard error, and estimated intercept and its standard error, and the p-value to test the significance of the model
Step by Step Solution
There are 3 Steps involved in it

Get step-by-step solutions from verified subject matter experts