

Question: Consider the following data table, excerpted from another textbook. Let us assume this data applies to the Acme Gravel Company, Inc. Notice the demand (i.e.
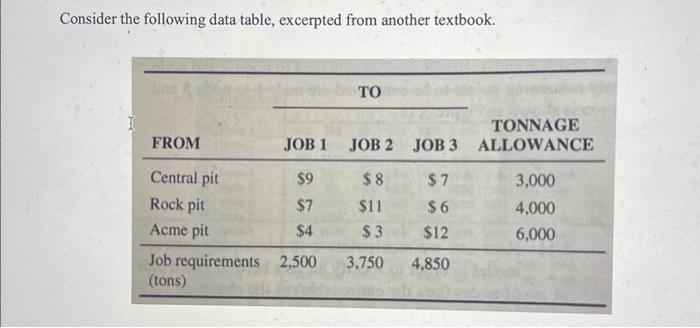
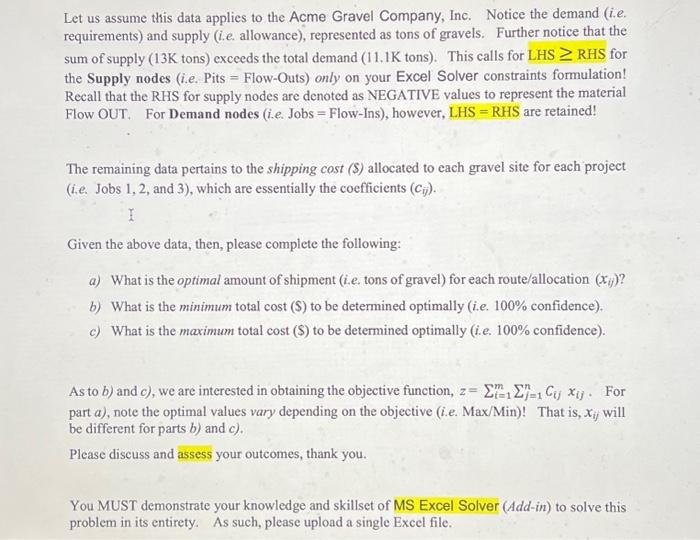
Consider the following data table, excerpted from another textbook. Let us assume this data applies to the Acme Gravel Company, Inc. Notice the demand (i.e. requirements) and supply (i.e. allowance), represented as tons of gravels. Further notice that the sum of supply ( \\( 13 \\mathrm{~K} \\) tons) exceeds the total demand (11.1K tons). This calls for LHS \\( \\geq \\mathrm{RHS} \\) for the Supply nodes (i.e. Pits = Flow-Outs) only on your Excel Solver constraints formulation! Recall that the RHS for supply nodes are denoted as NEGATIVE values to represent the material Flow OUT. For Demand nodes (i.e. Jobs = Flow-Ins), however, LHS = RHS are retained! The remaining data pertains to the shipping cost (\\$) allocated to each gravel site for each project (i.e. Jobs 1,2, and 3), which are essentially the coefficients \\( \\left(c_{i j}\ ight) \\). Given the above data, then, please complete the following: a) What is the optimal amount of shipment (i.e. tons of gravel) for each route/allocation \\( \\left(x_{i j}\ ight) \\) ? b) What is the minimum total cost (\\$) to be determined optimally (i.e. \100 confidence). c) What is the maximum total cost (\\$) to be determined optimally (i.e. \100 confidence). As to \\( b \\) ) and \\( c \\) ), we are interested in obtaining the objective function, \\( z=\\sum_{i=1}^{m} \\sum_{j=1}^{n} C_{i j} x_{i j} \\). For part \\( a \\) ), note the optimal values vary depending on the objective (i.e. Max/Min)! That is, \\( x_{i j} \\) will be different for parts \\( b \\) ) and \\( c \\) ). Please discuss and assess your outcomes, thank you. You MUST demonstrate your knowledge and skillset of MS Excel Solver (Add-in) to solve this problem in its entirety. As such, please upload a single Excel file
Step by Step Solution
There are 3 Steps involved in it

Get step-by-step solutions from verified subject matter experts