Answered step by step
Verified Expert Solution
Question
1 Approved Answer
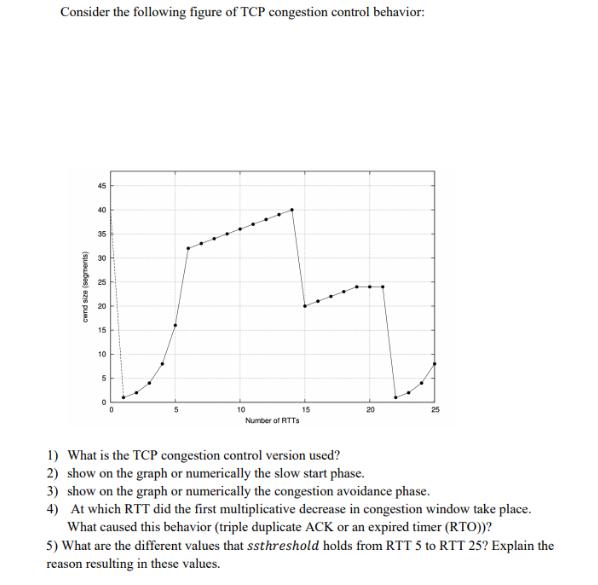
Consider the following figure of TCP congestion control behavior: 45 TH 10 cend size (segments) 40 10 9 35 15 10 5 Number of

Consider the following figure of TCP congestion control behavior: 45 TH 10 cend size (segments) 40 10 9 35 15 10 5 Number of RTTS 15 25 1) What is the TCP congestion control version used? 2) show on the graph or numerically the slow start phase. 3) show on the graph or numerically the congestion avoidance phase. 4) At which RTT did the first multiplicative decrease in congestion window take place. What caused this behavior (triple duplicate ACK or an expired timer (RTO))? 5) What are the different values that ssthreshold holds from RTT 5 to RTT 25? Explain the reason resulting in these values.
Step by Step Solution
★★★★★
3.36 Rating (152 Votes )
There are 3 Steps involved in it
Step: 1
Stepbystep solution to the TCP congestion control behavior image 1 What is the TCP congestion control version used The TCP congestion control version used in the image is TCP Reno This can be determin...
Get Instant Access to Expert-Tailored Solutions
See step-by-step solutions with expert insights and AI powered tools for academic success
Step: 2

Step: 3

Ace Your Homework with AI
Get the answers you need in no time with our AI-driven, step-by-step assistance
Get Started


