

Question: Consider the following frequency distribution table. Class Frequency 10-20 3 20-30 8 30-40 15 40-50 fi 50-60 f2 60-70 17 70-80 16 80-90 10 90-100
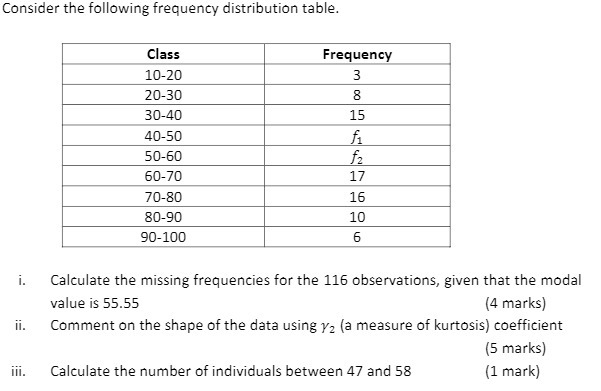
Consider the following frequency distribution table. Class Frequency 10-20 3 20-30 8 30-40 15 40-50 fi 50-60 f2 60-70 17 70-80 16 80-90 10 90-100 6 Calculate the missing frequencies for the 116 observations, given that the modal value is 55.55 (4 marks) ii. Comment on the shape of the data using yz (a measure of kurtosis) coefficient (5 marks) ili. Calculate the number of individuals between 47 and 58 (1 mark)
Step by Step Solution
There are 3 Steps involved in it
1 Expert Approved Answer
Step: 1 Unlock

Question Has Been Solved by an Expert!
Get step-by-step solutions from verified subject matter experts
Step: 2 Unlock
Step: 3 Unlock