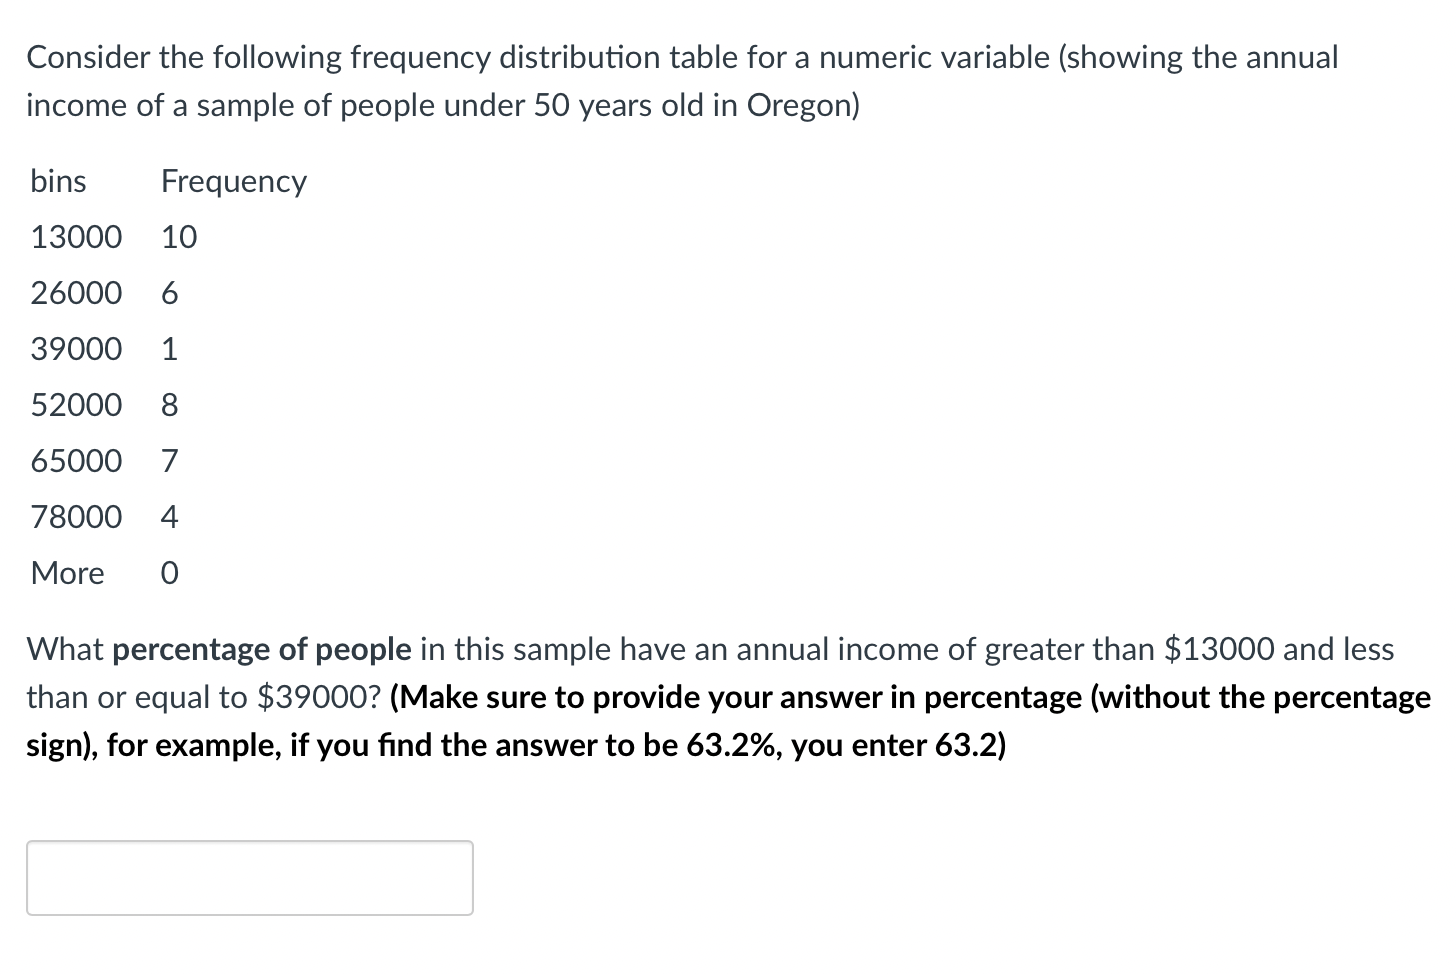
Question: Consider the following frequency distribution table for a numeric variable (showing the annual income of a sample of people under 50 years old in Oregon)

Consider the following frequency distribution

Consider the following frequency distribution table for a numeric variable (showing the annual income of a sample of people under 50 years old in Oregon) What percentage of people in this sample have an annual income of greater than $13000 and less than or equal to $39000 ? (Make sure to provide your answer in percentage (without the percentage sign), for example, if you find the answer to be 63.2%, you enter 63.2 )

Step by Step Solution

There are 3 Steps involved in it

1 Expert Approved Answer
Step: 1 Unlock blur-text-image
Question Has Been Solved by an Expert!

Get step-by-step solutions from verified subject matter experts

Step: 2 Unlock
Step: 3 Unlock

Students Have Also Explored These Related General Management Questions!