

Question: Consider the following frequency distribution table for a numeric variable (showing the annual income of a sample of people under 50 years old in
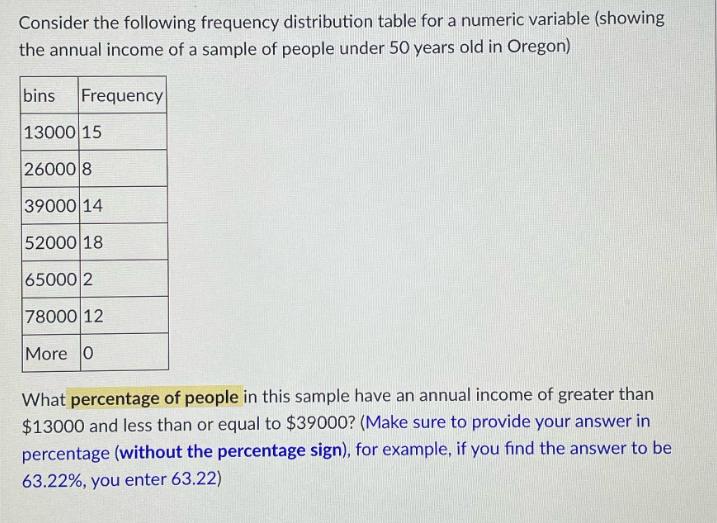
Consider the following frequency distribution table for a numeric variable (showing the annual income of a sample of people under 50 years old in Oregon) bins Frequency 13000 15 26000 8 39000 14 52000 18 65000 2 78000 12 More 0 What percentage of people in this sample have an annual income of greater than $13000 and less than or equal to $39000? (Make sure to provide your answer i percentage (without the percentage sign), for example, if you find the answer to be 63.22%, you enter 63.22)
Step by Step Solution
There are 3 Steps involved in it
To calculate the percentage of people with an annu... View full answer

Get step-by-step solutions from verified subject matter experts