

a. Construct a frequency distribution table for weights of male participants using the classes 91125, 126160, 161195,
Question:
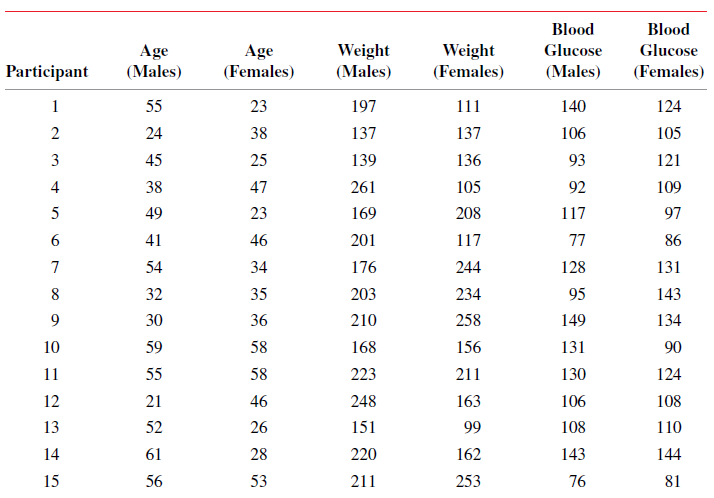
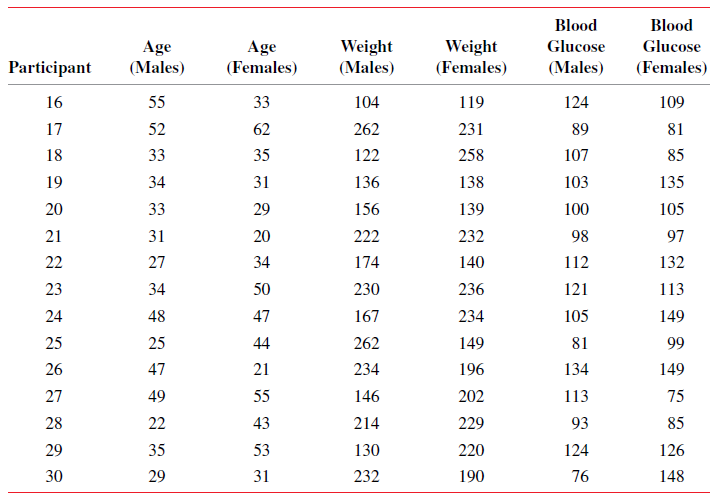
a. Construct a frequency distribution table for weights of male participants using the classes 91–125, 126–160, 161–195, 196–230, and 231–265.
b. Calculate the relative frequency and percentage for each class.
c. Construct a histogram for the relative frequency distribution of part b.
d. What percentage of the male participants have weights less than 161 lbs?
The following table includes partial data for a health fair held at a local mall by community college nursing students. The data are provided for 30 male and 30 female participants who stopped by the health fair booth. Data includes participant’s age to the nearest year, body weight in pounds, and blood glucose level measured in mg/dL.
The word "distribution" has several meanings in the financial world, most of them pertaining to the payment of assets from a fund, account, or individual security to an investor or beneficiary. Retirement account distributions are among the most...
Fantastic news! We've Found the answer you've been seeking!
Step by Step Answer:
a and b c d 2 730 30 of male participants weighed ...View the full answer

Answered By
Dinesh F
I have over 3 years of professional experience as an assignment tutor, and 1 year as a tutor trainee.
1+ Reviews
10+ Question Solved
Related Book For 
Question Posted:
