

Question: Consider the following graph and answer the True and False questions below. Circle the correct answer. 1. T or F Carry costs increase linearly as
Consider the following graph and answer the True and False questions below.
Circle the correct answer.
1. T or F Carry costs increase linearly as the firm purchases more inventory
2. T or F Ordering costs decrease with less frequent orders as demand increases
3. T or F EOQ is always the cheapest inventory system regardless of the quantity discounts offered.
4. T or F EOQ is a model that minimizes Total carrying costs no matter what the order size is.
5. T or F EOQ will help a firm minimize TIC and thereby, maximize shareholder wealth.
6. T or F Safety stock will alter the EOQ point on the graph.
7. T or F An EOQ model cannot be used if the firm uses a just-in-time inventory system.
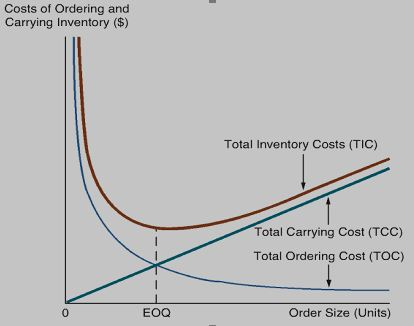
1 Costs of Ordering and Carrying Inventory ($) Total Inventory Costs (TIC) Total Carrying Cost (TCC) Total Ordering Cost (TOC) 0 EOQ Order Size (Units)
Step by Step Solution
There are 3 Steps involved in it

Get step-by-step solutions from verified subject matter experts