

Question: Consider the following graph. Create one table with data from this graph. Redraw the graph, using the best practices for data visualization and using 2
Consider the following graph. Create one table with data from this graph. Redraw the graph, using the best practices for data visualization and using 2 separate graphs.
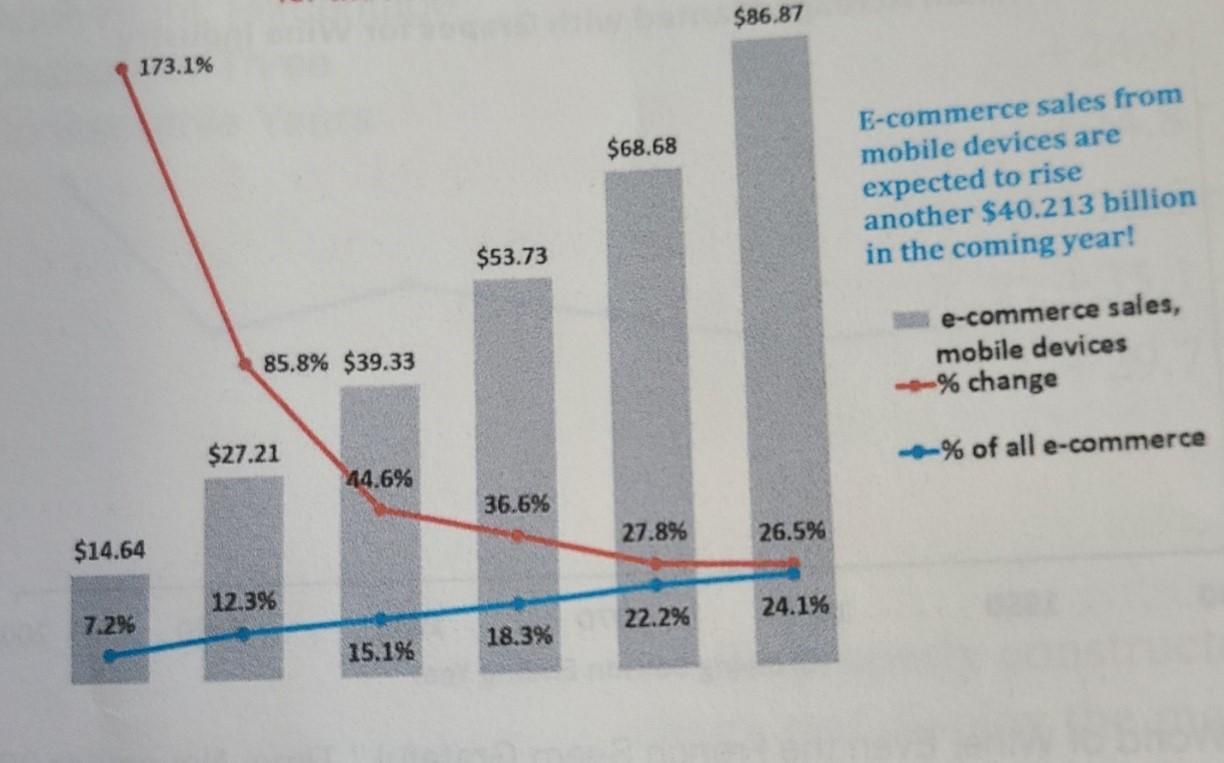
173.1% $14.64 7.2% 85.8% $39.33 $27.21 12.3% 44.6% 15.1% $53.73 36.6% 18.3% $68.68 27.8% 22.2% $86.87 26.5% 24.1% E-commerce sales from mobile devices are expected to rise another $40.213 billion in the coming year! e-commerce sales, mobile devices -% change -% of all e-commerce
Step by Step Solution
3.52 Rating (142 Votes )
There are 3 Steps involved in it
Step 12 From the graph Creating a table for the data repre... View full answer

Get step-by-step solutions from verified subject matter experts