

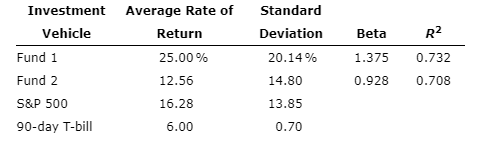
Question: Consider the following historical performance data for two different portfolios, the Standard and Poors 500, and the 90-day T-bill. a. Calculate the Fama overall performance
Consider the following historical performance data for two different portfolios, the Standard and Poors 500, and the 90-day T-bill.
a. Calculate the Fama overall performance measure for both funds. Round your answers to two decimal places.
Overall performance (Fund 1): ____ %
Overall performance (Fund 2): ____ %
b) What is the return to risk for both funds? Do not round intermediate calculations. Round your answers to two decimal places.
Return to risk (Fund 1): ____ %
Return to risk (Fund 2): ____ %
c) For both funds, compute the measures of (1) selectivity, (2) diversification, and (3) net selectivity. Do not round intermediate calculations. Round your answers to two decimal places. Use a minus sign to enter negative values, if any.
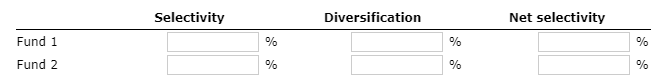
d) Explain the meaning of the net selectivity measure and how it helps you evaluate investor performance. Which fund had the best performance?
The net selectivity is an unexplained portion of the excess _____________ (return/ risk) ___________(reduced by the cost of incomplete/ increased by the benefit from perfect) diversification. The higher the net selectivity the ___________ (better/worse) investor performance is. __________ (Fund 1/ Fund 2)had the best performance.
Investment Average Rate of Standard Vehicle Deviation 20.14 % 14.80 13.85 0.70 Beta 1.375 0.732 0.928 0.708 Return Fund 1 Fund 2 S&P 500 90-day T-bill 25.00% 12.56 16.28 6.00 Selectivity Diversification Net selectivity Fund 1 Fund 2
Step by Step Solution
There are 3 Steps involved in it

Get step-by-step solutions from verified subject matter experts