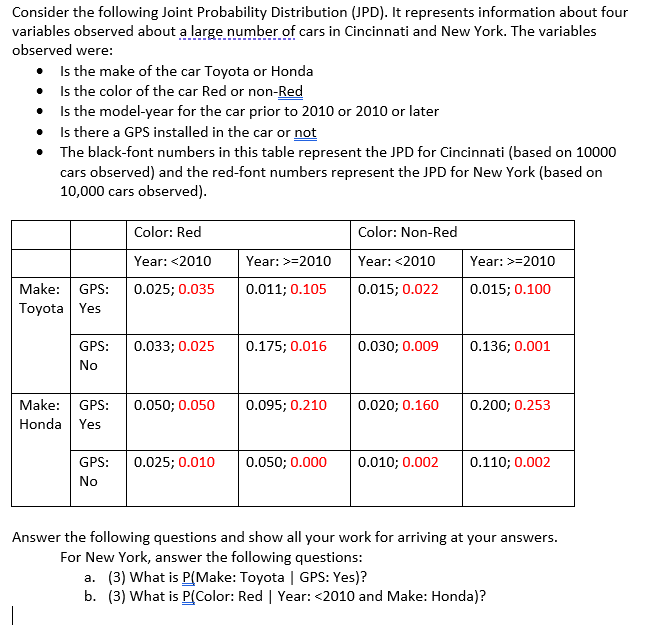
Question: Consider the following Joint Probability Distribution (JPD). It represents information about four variables observed about a large number of cars in Cincinnati and New York.

Consider the following Joint Probability

Consider the following Joint Probability Distribution (JPD). It represents information about four variables observed about a large number of cars in Cincinnati and New York. The variables observed were: Is the make of the car Toyota or Honda Is the color of the car Red or non-Red Is the model-year for the car prior to 2010 or 2010 or later Is there a GPS installed in the car or not The black-font numbers in this table represent the JPD for Cincinnati (based on 10000 cars observed) and the red-font numbers represent the JPD for New York (based on 10,000 cars observed). Color: Red Color: Non-Red Year: =2010 Year: =2010 0.025; 0.035 0.011; 0.105 0.015; 0.022 0.015; 0.100 Make: GPS: Toyota Yes 0.033; 0.025 0.175; 0.016 0.030; 0.009 0.136; 0.001 GPS: No Make: GPS: Honda Yes 0.050;0.050 0.095; 0.210 0.020; 0.160 0.200; 0.253 0.025; 0.010 0.050;0.000 0.010; 0.002 0.110; 0.002 GPS: No Answer the following questions and show all your work for arriving at your answers. For New York, answer the following questions: a. (3) What is P(Make: Toyota | GPS: Yes)? b. (3) What is (Color: Red Year:

Step by Step Solution

There are 3 Steps involved in it

1 Expert Approved Answer
Step: 1 Unlock blur-text-image
Question Has Been Solved by an Expert!

Get step-by-step solutions from verified subject matter experts

Step: 2 Unlock
Step: 3 Unlock

Students Have Also Explored These Related General Management Questions!