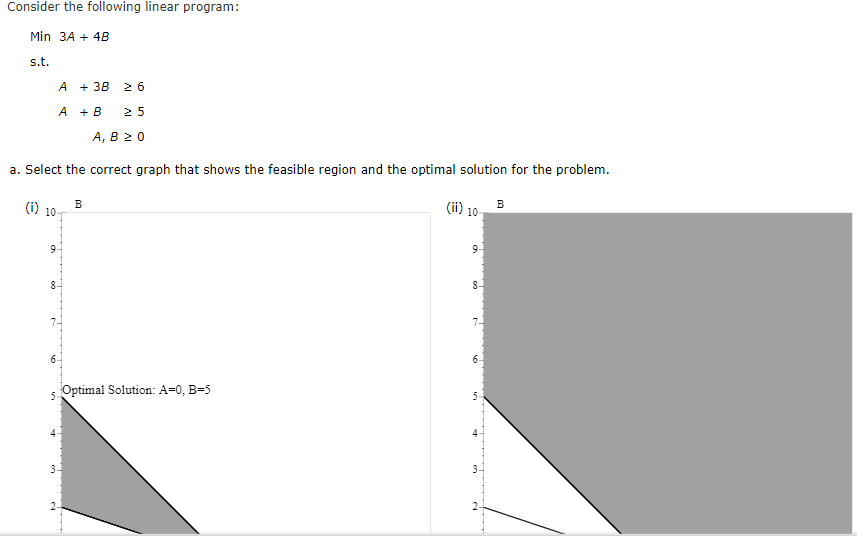
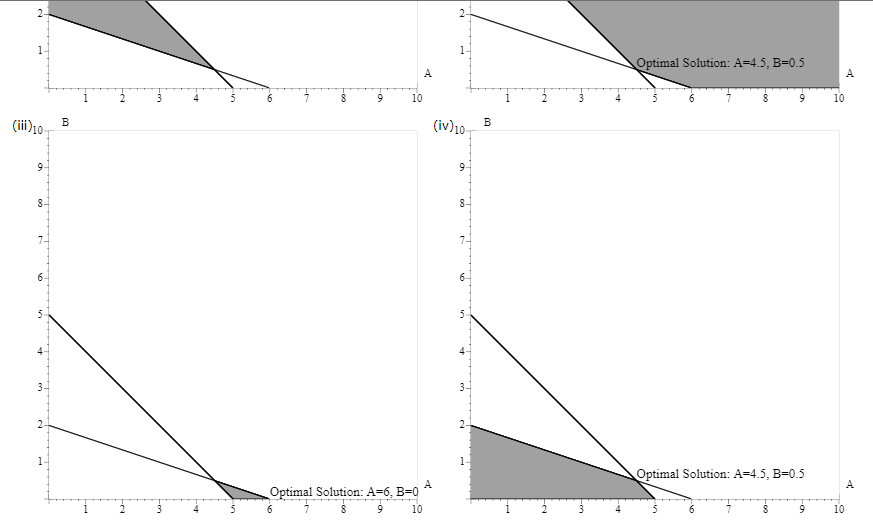
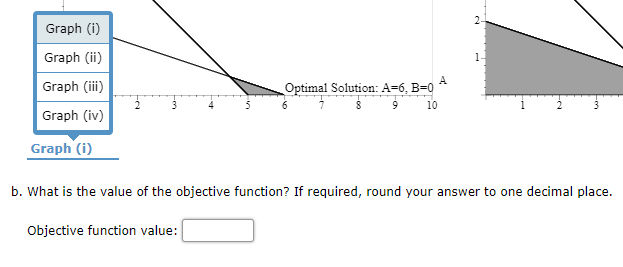
Question: Consider the following linear program: Min 3A + 4B s.t. A + 3B A+B > 5 A,B20 a. Select the correct graph that shows the

Consider the following linear program: Min 3A +

Consider the following linear program: Min 3A +

Consider the following linear program: Min 3A +

Consider the following linear program: Min 3A + 4B s.t. A + 3B A+B > 5 A,B20 a. Select the correct graph that shows the feasible region and the optimal solution for the problem. 1) 10 09 B 10 9 9 8 8- 7. 6 6 Optimal Solution: A=0, B=5 5 3 3 3- 2 2 2 1 1 Optimal Solution: A=4.5, B=0.5 A 5 6 9 10 6 7 8 9 10 B (iii) 10 B (iv) 10 9 9 8 8 7- 7. 6 5 5 3- 3- 2 2 1 1 Optimal Solution: A=4.5, B=0.5 A A Optimal Solution: A=6, B=0 9 10 2 5 8 3 4 5 6 7 8 9 10 2 Graph (0) 1 Graph (ii) Graph (iii) Graph (iv) A Optimal Solution: A-6, B=0 10 2 Graph (i) b. What is the value of the objective function? If required, round your answer to one decimal place. Objective function value

Step by Step Solution

There are 3 Steps involved in it

1 Expert Approved Answer
Step: 1 Unlock blur-text-image
Question Has Been Solved by an Expert!

Get step-by-step solutions from verified subject matter experts

Step: 2 Unlock
Step: 3 Unlock

Students Have Also Explored These Related General Management Questions!