

Question: Consider the following queueing network that represents a 4 - station manufacturing system. The arrows show part flow through the system ( Stations A ,
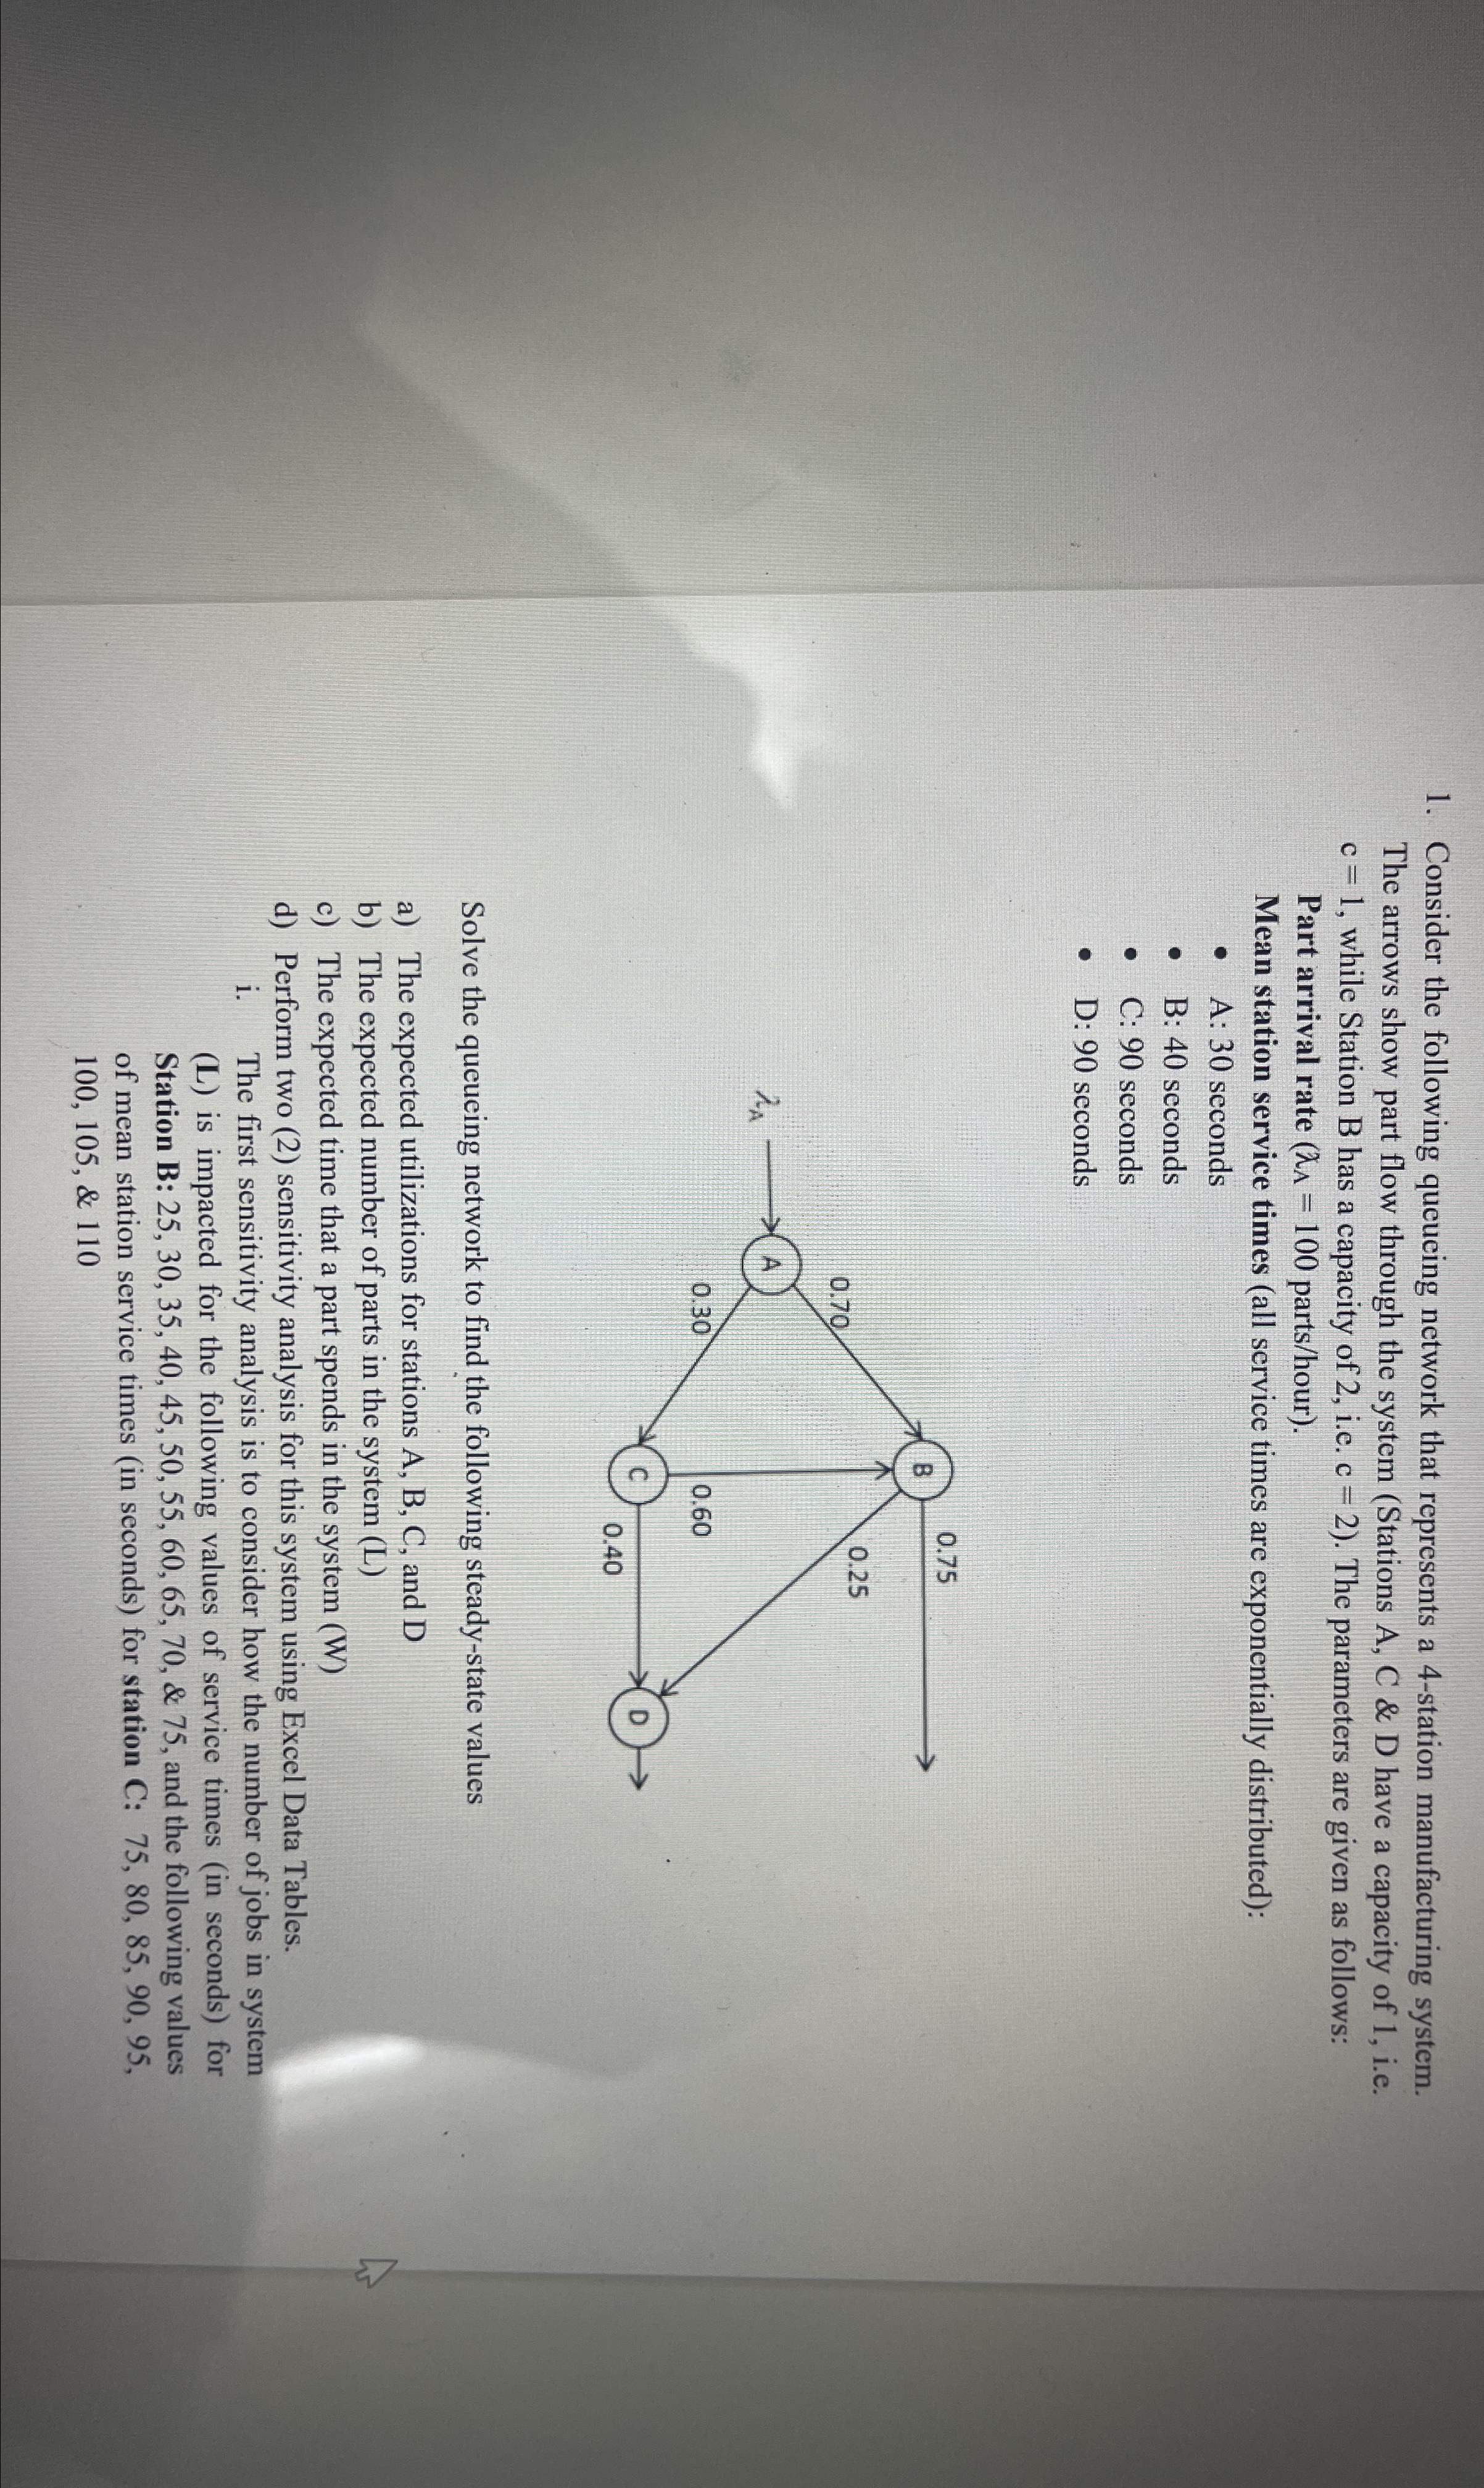
Consider the following queueing network that represents a station manufacturing system. The arrows show part flow through the system Stations A C & D have a capacity of ie while Station B has a capacity of ie The parameters are given as follows:
Part arrival rate partshour
Mean station service times all service times are exponentially distributed:
A: seconds
B: seconds
C: seconds
D: seconds
Solve the queueing network to find the following steadystate values
a The expected utilizations for stations A B C and D
b The expected number of parts in the system L
c The expected time that a part spends in the system W
d Perform two sensitivity analysis for this system using Excel Data Tables.
i The first sensitivity analysis is to consider how the number of jobs in system L is impacted for the following values of service times in seconds for Station B: & and the following values of mean station service times in seconds for station C: &
Step by Step Solution
There are 3 Steps involved in it
1 Expert Approved Answer
Step: 1 Unlock

Question Has Been Solved by an Expert!
Get step-by-step solutions from verified subject matter experts
Step: 2 Unlock
Step: 3 Unlock