

Question: Consider the following sample data with mean and standard deviation of 15.5 and 7.3, respectively. (You may find it useful to reference the appropriate table:
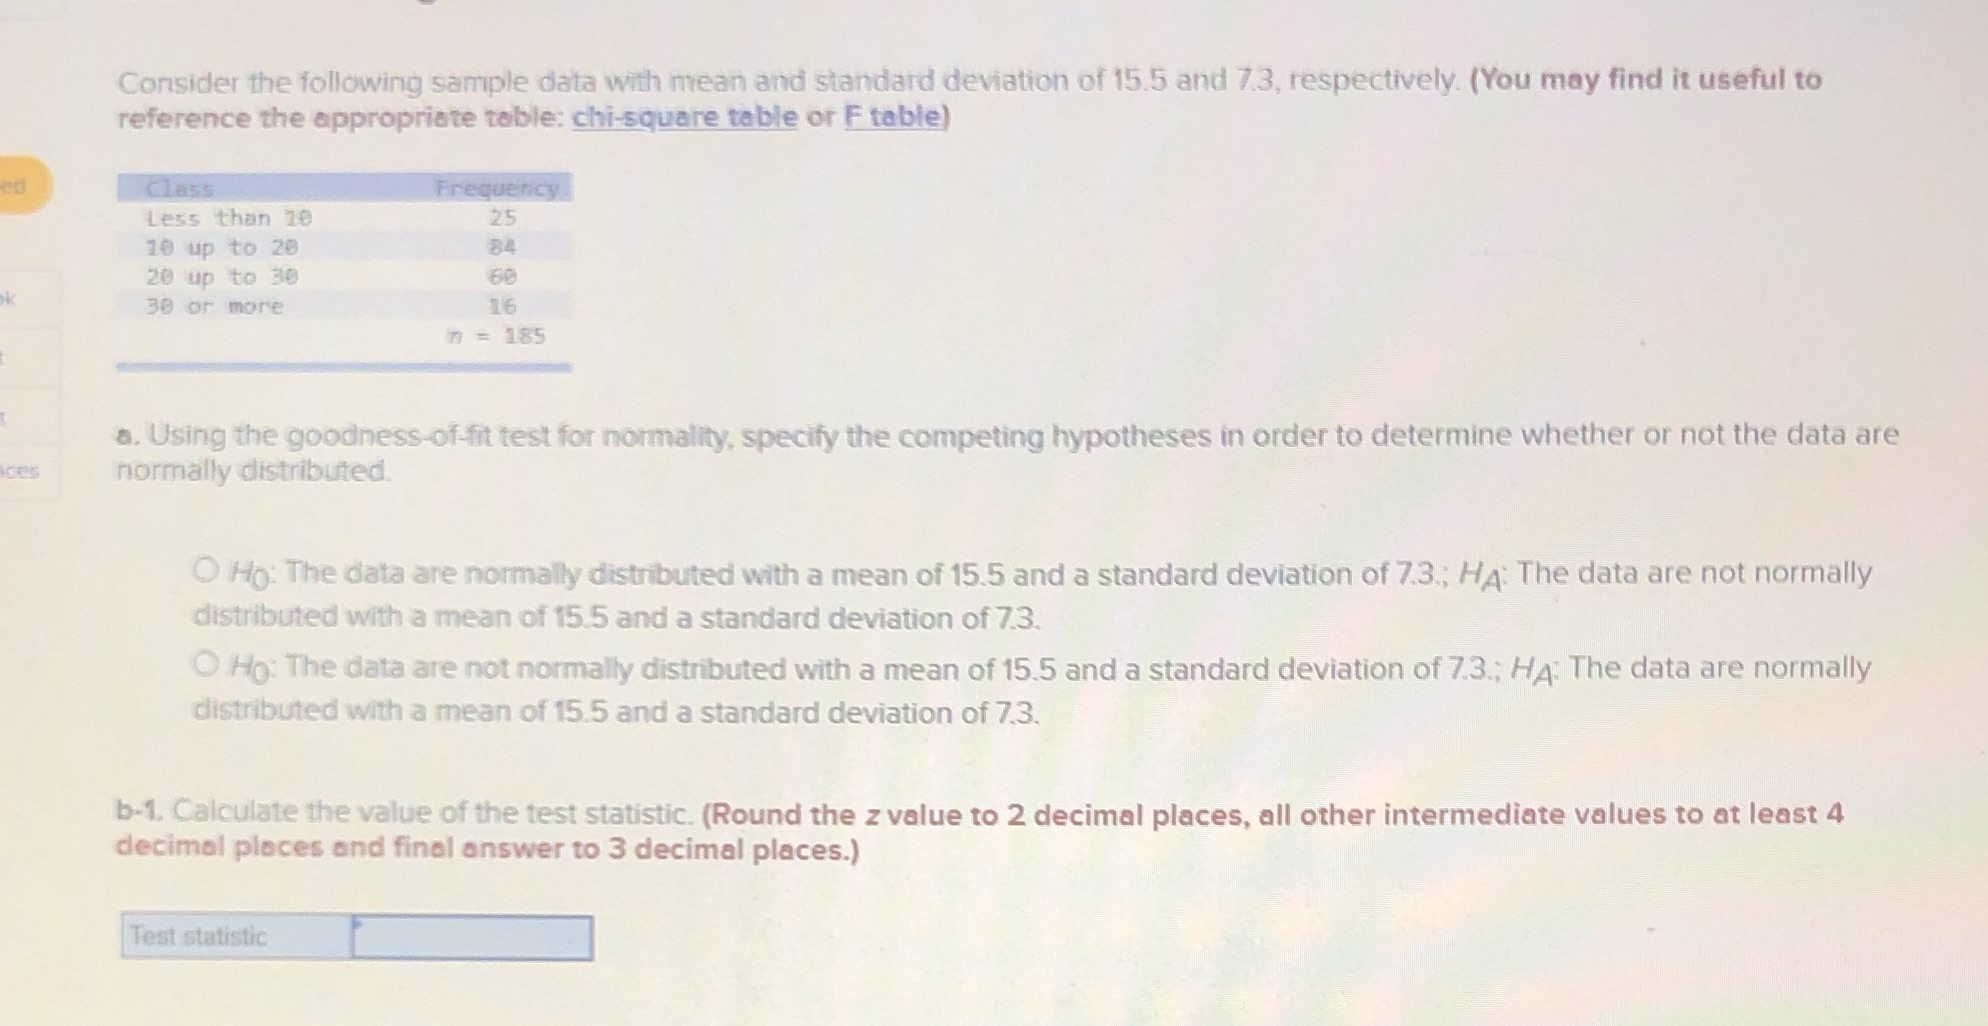
Consider the following sample data with mean and standard deviation of 15.5 and 7.3, respectively. (You may find it useful to reference the appropriate table: chi-square table or F table) ed Class Frequency Less than 10 25 10 up to 20 84 20 up to 30 60 30 or more 16 n = 185 a. Using the goodness-of-fit test for normality, specify the competing hypotheses in order to determine whether or not the data are normally distributed O Ho: The data are normally distributed with a mean of 15.5 and a standard deviation of 7.3.; HA: The data are not normally distributed with a mean of 15.5 and a standard deviation of 7.3. O Ho: The data are not normally distributed with a mean of 15.5 and a standard deviation of 7.3.; HA: The data are normally distributed with a mean of 15.5 and a standard deviation of 7.3. b-1. Calculate the value of the test statistic. (Round the z value to 2 decimal places, all other intermediate values to at least 4 decimal places and final answer to 3 decimal places.) Test statistic
Step by Step Solution
There are 3 Steps involved in it

Get step-by-step solutions from verified subject matter experts