

Question: Consider the following scatterplot which shows the relationship between weekly customers and costs Coefficients Standard Error P-value 95% confidence interval Intercept 24,600 Not required Not

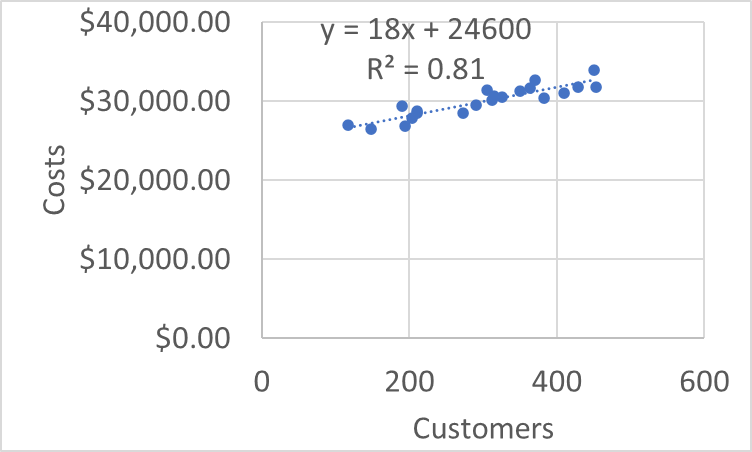
Consider the following scatterplot which shows the relationship between weekly customers and costs
Coefficients | Standard Error | P-value | 95% confidence interval | |
Intercept | 24,600 | Not required | Not required | Not required |
costs | 18 | 2 | 1.8e-08 | Between 14 and 22 |
a) Describe the relationship between the two variables
b) Explain why there is strong evidence of a relationship between the variables
c) Interpret the coefficient of determinationR2
Answer text
Step by Step Solution
There are 3 Steps involved in it
1 Expert Approved Answer
Step: 1 Unlock

Question Has Been Solved by an Expert!
Get step-by-step solutions from verified subject matter experts
Step: 2 Unlock
Step: 3 Unlock