

Question: Consider the following scatterplot which shows the relationship between weekly customers and costs $40,000.00 y = 18x + 24600 R2 = 0.81 530,000.00 ' ___?

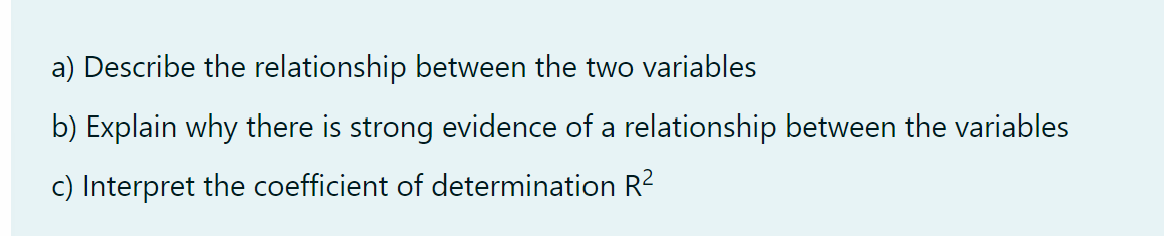


Consider the following scatterplot which shows the relationship between weekly customers and costs $40,000.00 y = 18x + 24600 R2 = 0.81 530,000.00 ' ___? ...... 605- '6'": $20,000.00 Costs $10,000.00 $0.00 0 200 400 600 Customers _- Standard Error 95% confidence interval a) Describe the relationship between the two variables b) Explain why there is strong evidence of a relationship between the variables c) Interpret the coefficient of determination R2
Step by Step Solution
There are 3 Steps involved in it
1 Expert Approved Answer
Step: 1 Unlock

Question Has Been Solved by an Expert!
Get step-by-step solutions from verified subject matter experts
Step: 2 Unlock
Step: 3 Unlock