

Question: please answer these. Consider the following scatterplot and regression analysis based on n=102 observation. The regression analysis and scatterplot help you understand the relationship between
please answer these.
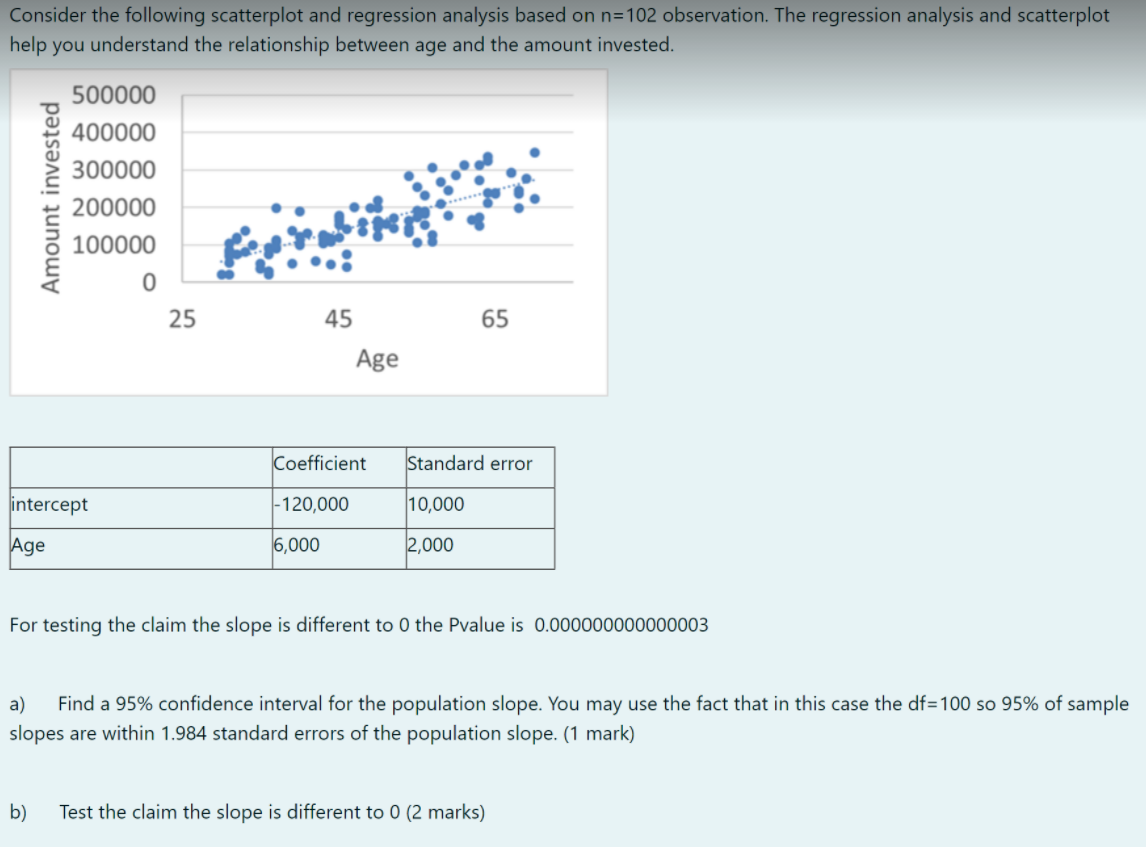
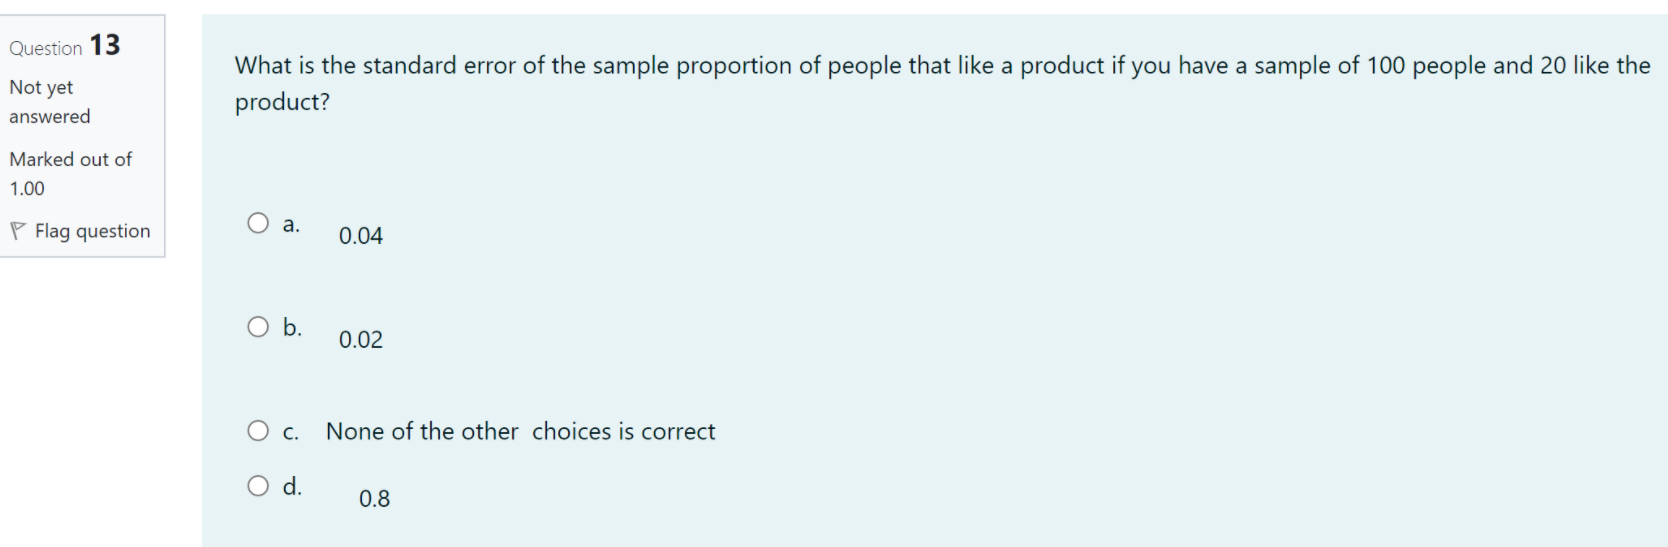
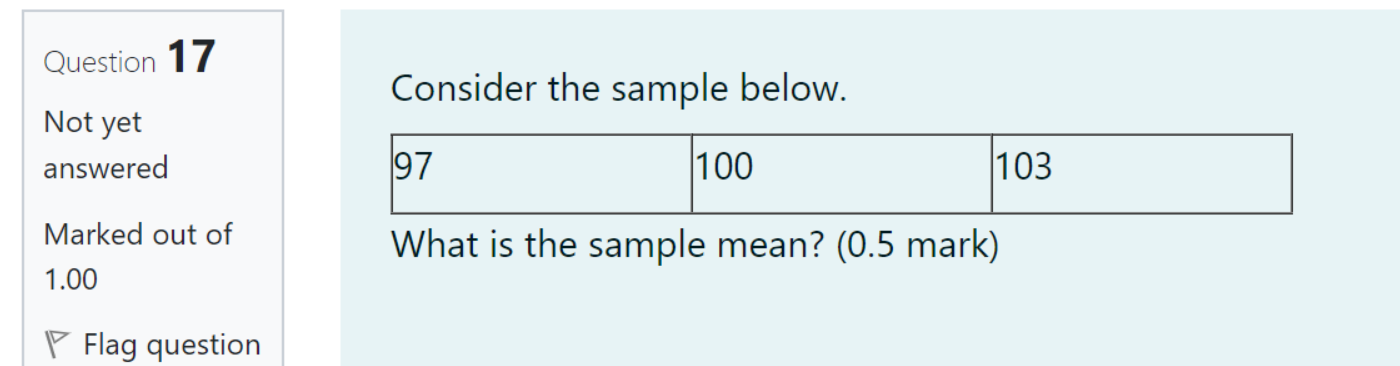
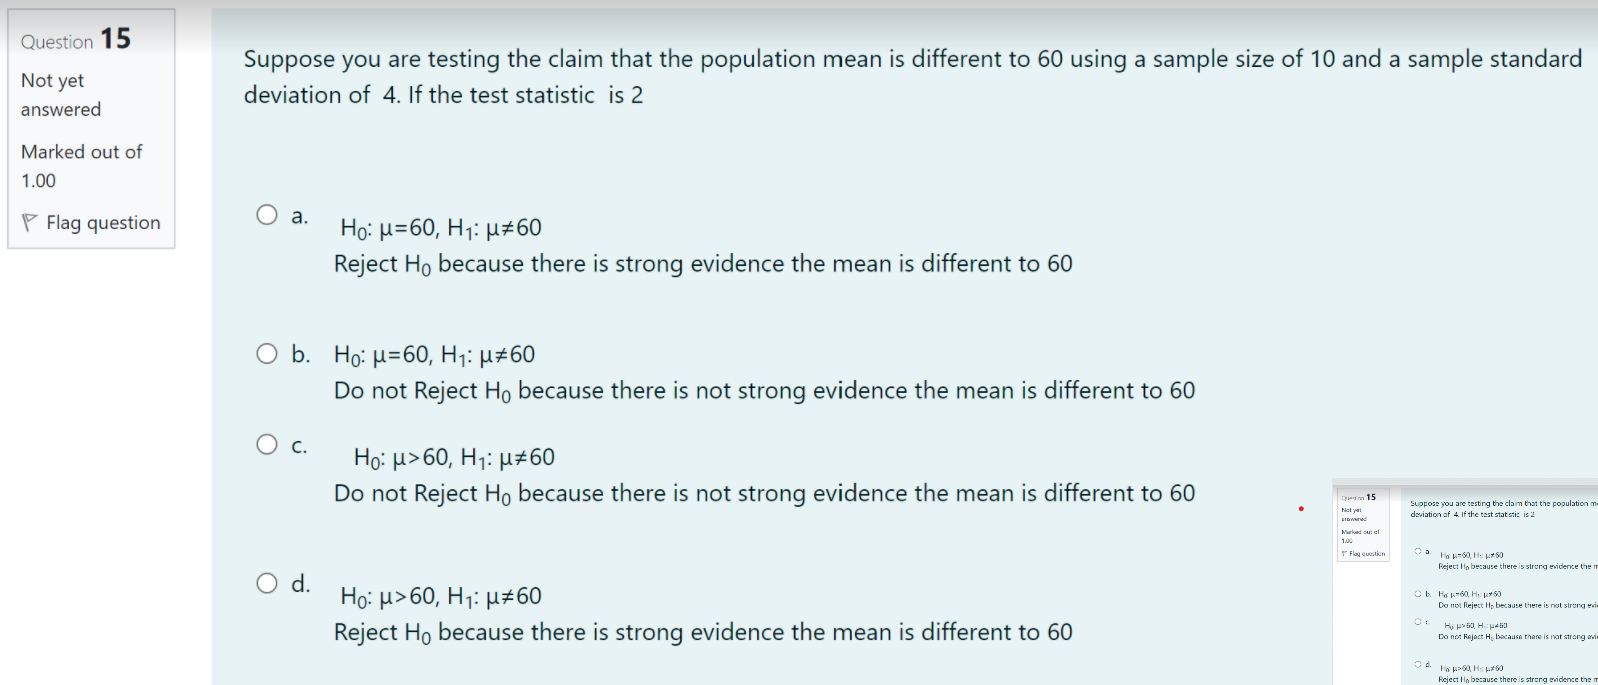
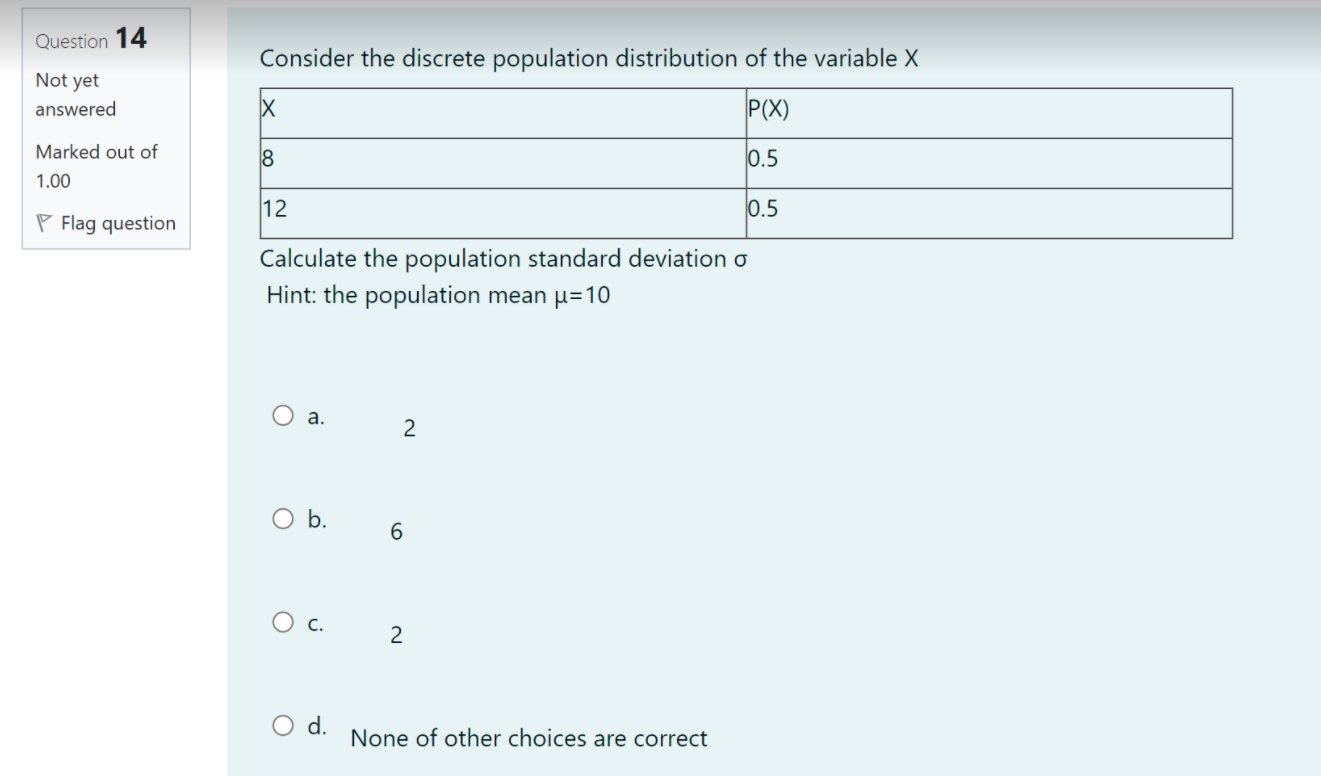
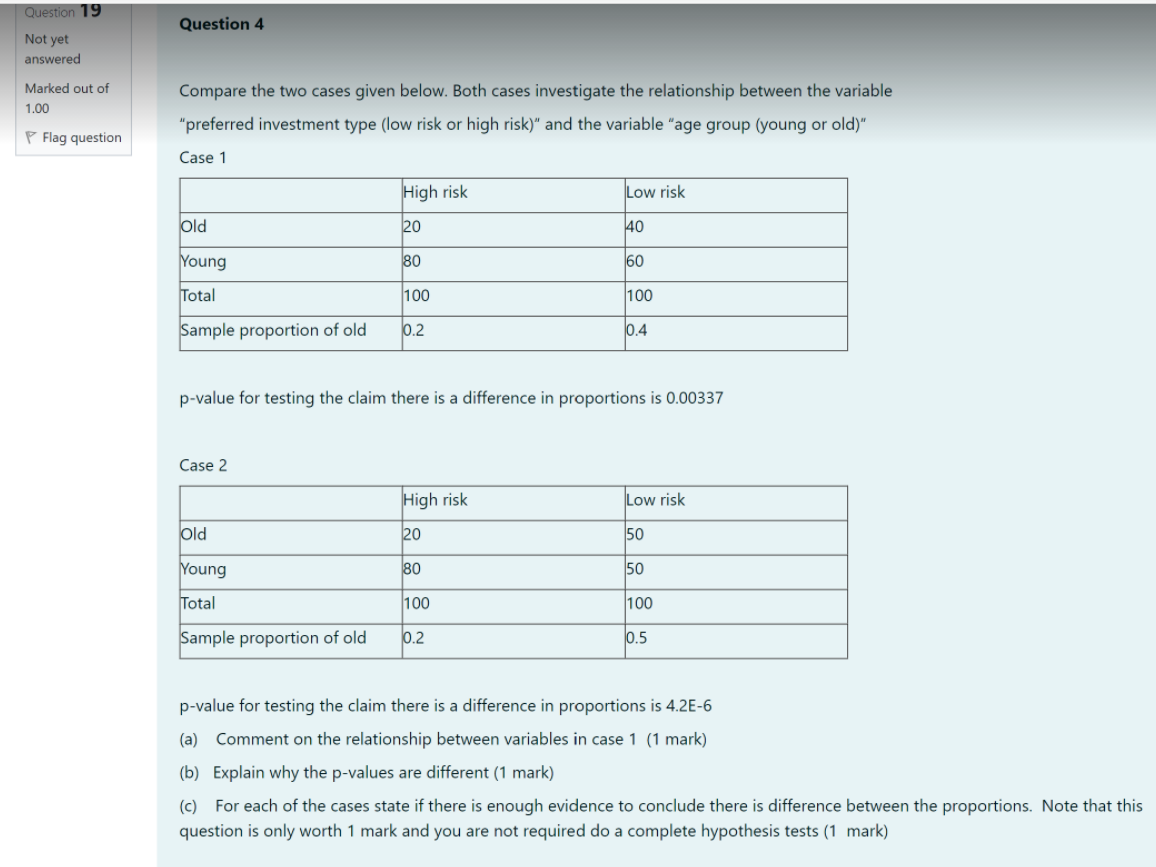
Consider the following scatterplot and regression analysis based on n=102 observation. The regression analysis and scatterplot help you understand the relationship between age and the amount invested. 500000 400000 300000 Amount invested 200000 100000 . .. : 0 25 45 65 Age Coefficient Standard error intercept -120,000 10,000 Age 6,000 2,000 For testing the claim the slope is different to 0 the Pvalue is 0.000000000000003 a) Find a 95% confidence interval for the population slope. You may use the fact that in this case the df=100 so 95% of sample slopes are within 1.984 standard errors of the population slope. (1 mark) b) Test the claim the slope is different to 0 (2 marks)Question 13 What is the standard error of the sample proportion of people that like a product if you have a sample of 100 people and 20 like the Not yet product? answered Marked out of 1.00 Flag question O a. 0.04 O b. 0.02 O c. None of the other choices is correct O d. 0.8Question 17 _ ConSIder the sample below. Not yet MarkEd OUt Of What is the sample mean? (0.5 mark) 1.00 V Flag question Question 15 Suppose you are testing the claim that the population mean is different to 60 using a sample size of 10 and a sample standard Not yet deviation of 4. If the test statistic is 2 answered Marked out of 1.00 Flag question O a. Ho: H=60, H1: 14# 60 Reject Ho because there is strong evidence the mean is different to 60 O b. Ho: H=60, H1: H1#60 Do not Reject Ho because there is not strong evidence the mean is different to 60 O c. Ho: H> 60, H1: H#60 Do not Reject Ho because there is not strong evidence the mean is different to 60 Suppose you are testing the claim that the population m deviation of 4. If the test statistic is 2 Marked out uf 1.00 T Flag question O a Hok=60, H- 1x60 Reject In because there is strong evidence the O d. Ho: M> 60, H1: 14$ 60 O b. Ha K=60, H 1x 50 Do not Reject Ho because there is not strung Reject Ho because there is strong evidence the mean is different to 60 O : Ho- H> 50, HH-50 Do not Reject H, because there is not strang a Od.Not yet answered Marked out of 1.00 '7 Flag question Calculate the population standard deviation 0 Hint: the population mean p=10 0a. 2 Ob. 6 0c. 2 0d. None of other choices are correct Que-\"i0\" 22 When should you use the null and alternative Hypothesis H0: p1=u2 H1: u1u2 ? (1 mark) Not yet answered Marked out of 1.00 V Flag question Question 19 Question 4 Not yet answered Marked out of 1.00 Compare the two cases given below. Both cases investigate the relationship between the variable Flag question "preferred investment type (low risk or high risk)" and the variable "age group (young or old)" Case 1 High risk Low risk Old 20 40 Young 80 60 Total 100 100 Sample proportion of old 10.2 0.4 p-value for testing the claim there is a difference in proportions is 0.00337 Case 2 High risk Low risk Old 20 50 Young 80 50 Total 100 100 Sample proportion of old 0.2 0.5 p-value for testing the claim there is a difference in proportions is 4.2E-6 (a) Comment on the relationship between variables in case 1 (1 mark) (b) Explain why the p-values are different (1 mark) (c) For each of the cases state if there is enough evidence to conclude there is difference between the proportions. Note that this question is only worth 1 mark and you are not required do a complete hypothesis tests (1 mark)
Step by Step Solution
There are 3 Steps involved in it

Get step-by-step solutions from verified subject matter experts