

Question: Consider the following script: % script to generate a plot of temperature, pressure and density % for the International Standard Atmosphere clc , clf h
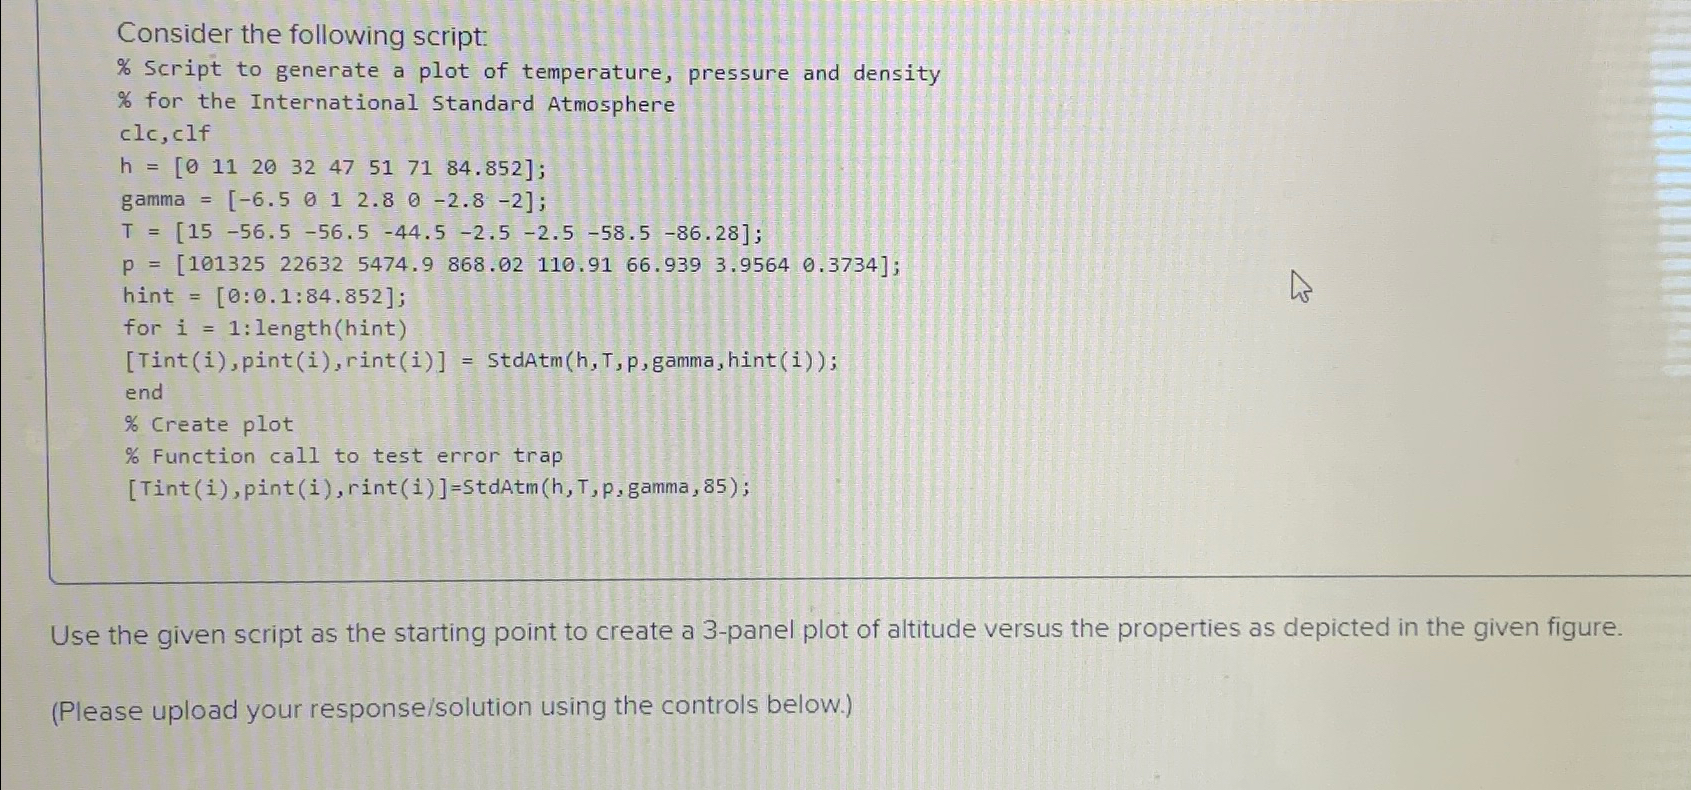
Consider the following script:
script to generate a plot of temperature, pressure and density
for the International Standard Atmosphere
clc clf
;
;
hint ::;
for : lengthhint
StdAtm;
end
create plot
Function call to test error trap
Tinti pinti rintiStdAtm h T p gamma, ;
Use the given script as the starting point to create a panel plot of altitude versus the properties as depicted in the given figure.
Please upload your responsesolution using the controls below.
Step by Step Solution
There are 3 Steps involved in it
1 Expert Approved Answer
Step: 1 Unlock

Question Has Been Solved by an Expert!
Get step-by-step solutions from verified subject matter experts
Step: 2 Unlock
Step: 3 Unlock