

Question: Consider the following time series data. (a) Construct a time series plot. What type of pattern exists in the data? The time series plot shows
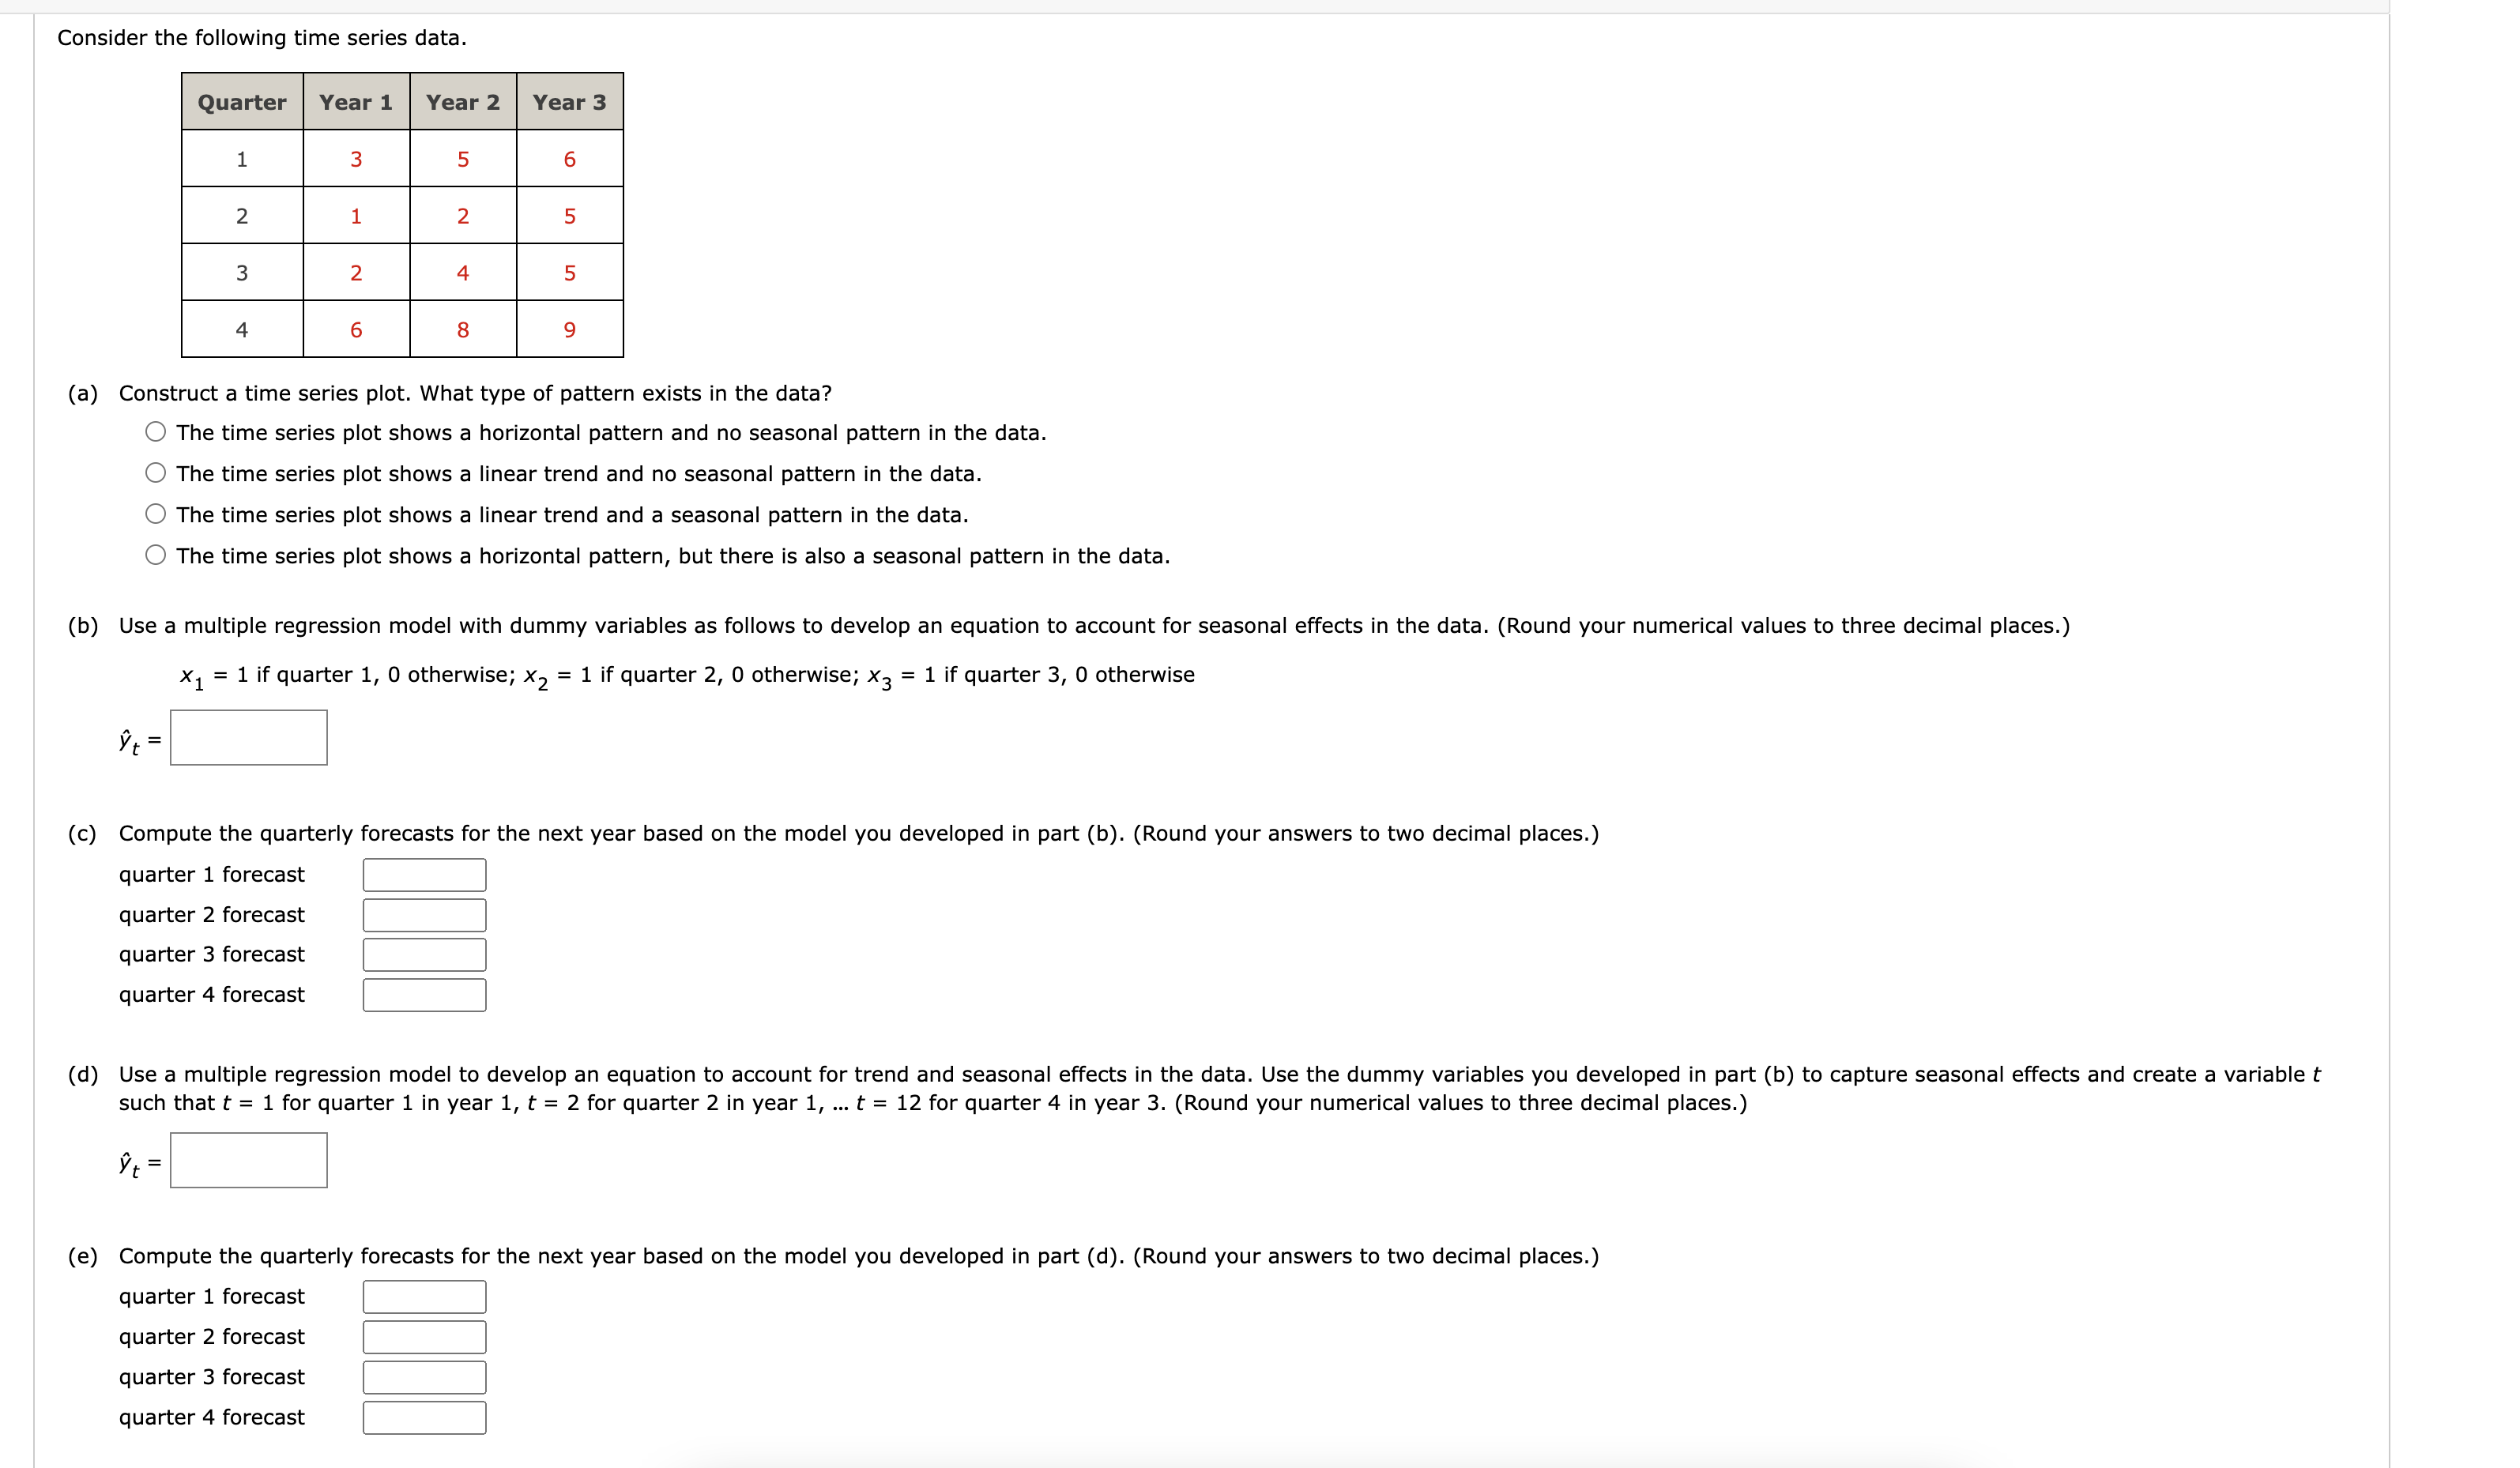
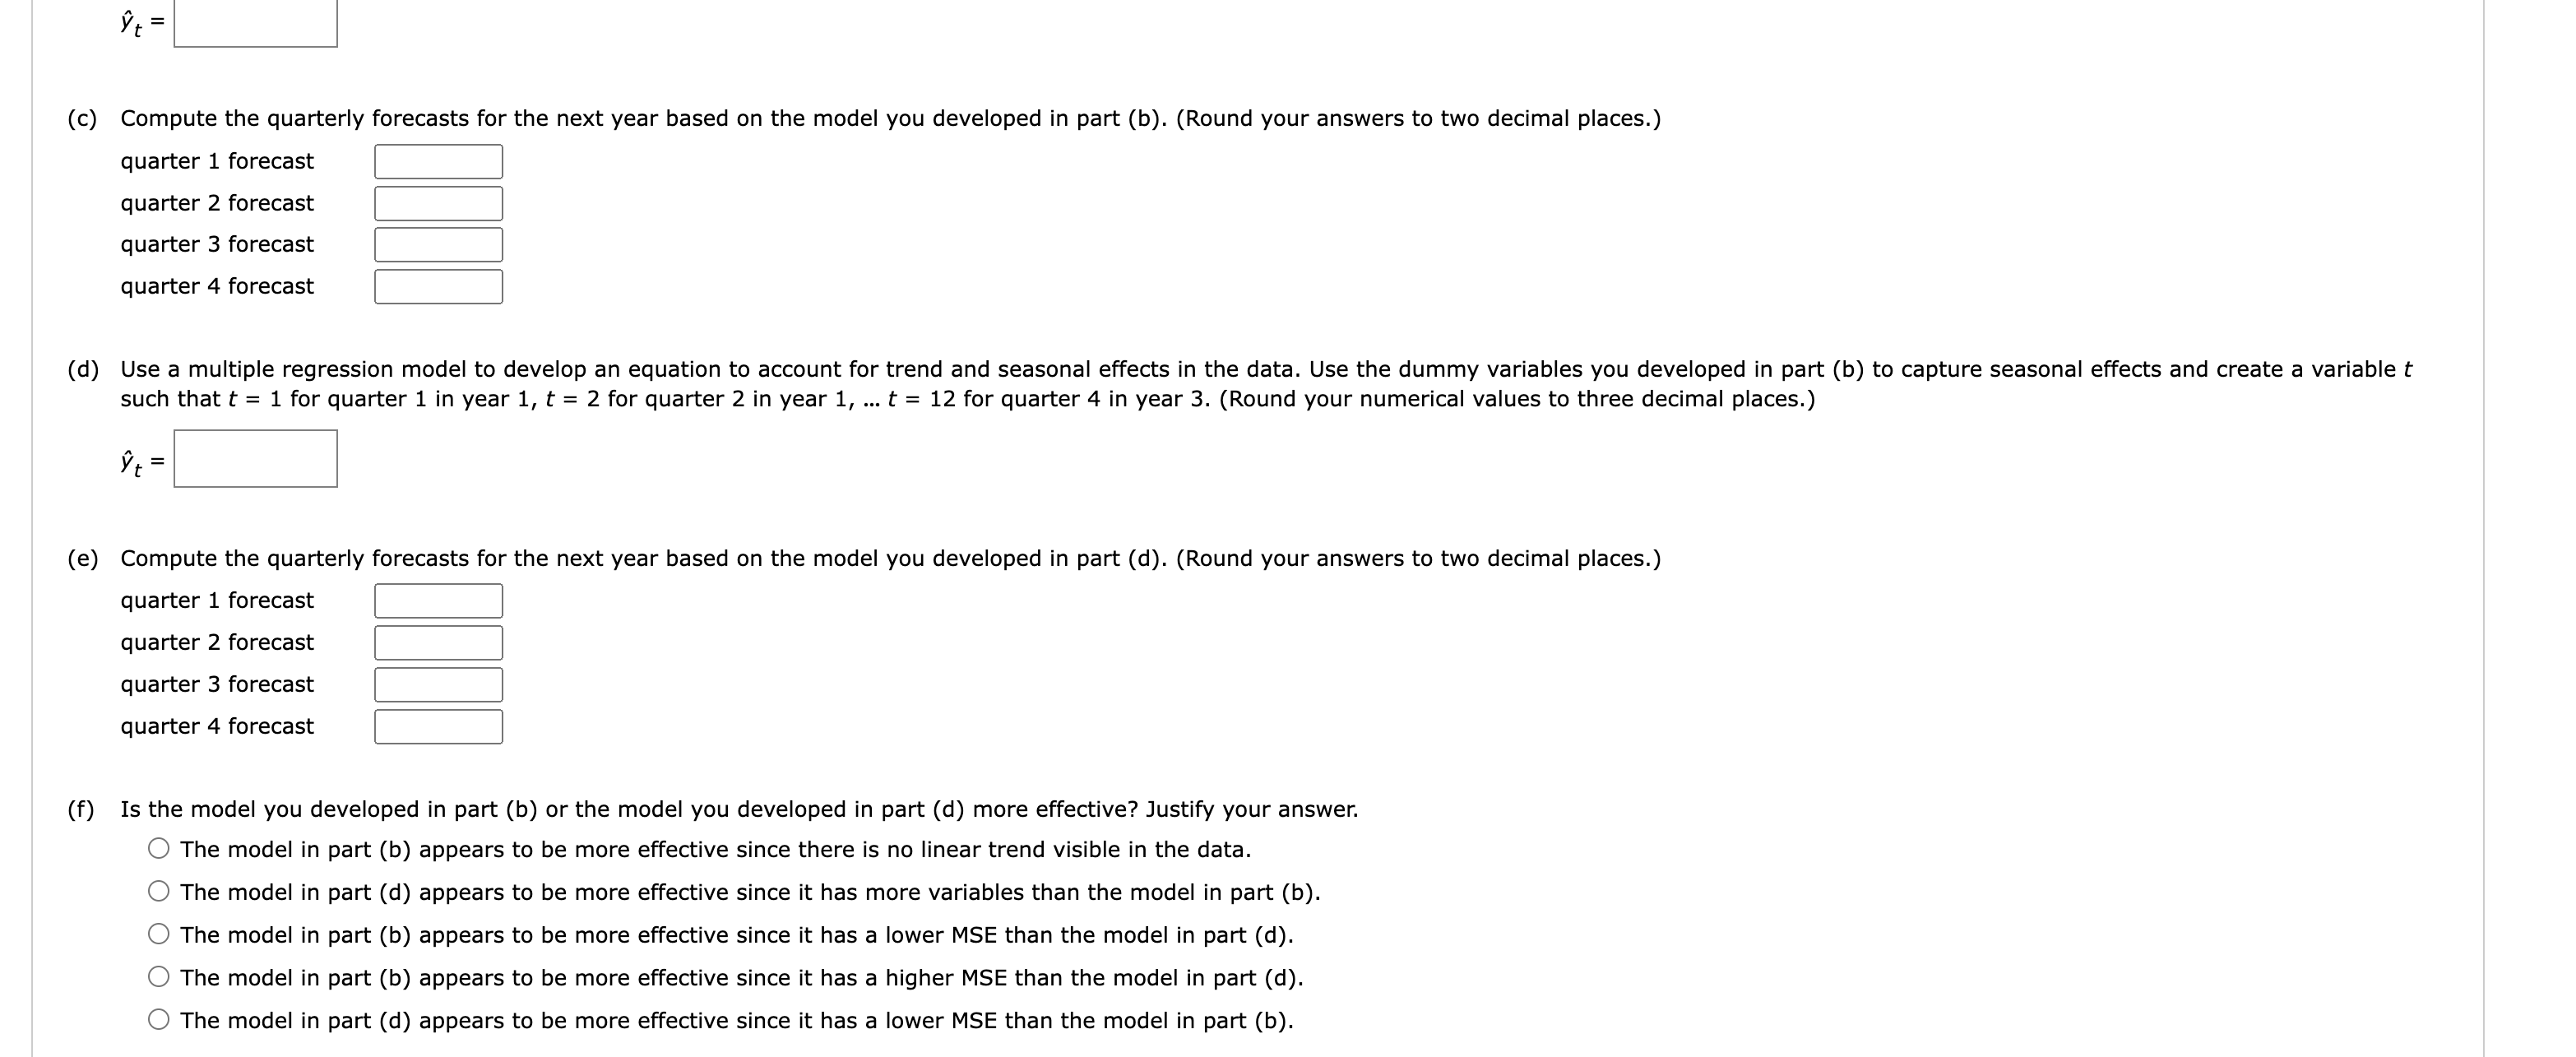
Consider the following time series data. (a) Construct a time series plot. What type of pattern exists in the data? The time series plot shows a horizontal pattern and no seasonal pattern in the data. The time series plot shows a linear trend and no seasonal pattern in the data. The time series plot shows a linear trend and a seasonal pattern in the data. The time series plot shows a horizontal pattern, but there is also a seasonal pattern in the data. x1=1 if quarter 1,0 otherwise; x2=1 if quarter 2,0 otherwise; x3=1 if quarter 3,0 otherwise y^t= (c) Compute the quarterly forecasts for the next year based on the model you developed in part (b). (Round your answers to two decimal places.) quarter 1 forecast quarter 2 forecast quarter 3 forecast quarter 4 forecast such that t=1 for quarter 1 in year 1,t=2 for quarter 2 in year 1,t=12 for quarter 4 in year 3 . (Round your numerical values to three decimal places.) y^t= (e) Compute the quarterly forecasts for the next year based on the model you developed in part (d). (Round your answers to two decimal places.) quarter 1 forecast quarter 2 forecast quarter 3 forecast quarter 4 forecast (c) Compute the quarterly forecasts for the next year based on the model you developed in part (b). (Round your answers to two decimal places.) quarter 1 forecast quarter 2 forecast quarter 3 forecast quarter 4 forecast such that t=1 for quarter 1 in year 1,t=2 for quarter 2 in year 1,t=12 for quarter 4 in year 3 . (Round your numerical values to three decimal places.) y^t=[ (e) Compute the quarterly forecasts for the next year based on the model you developed in part (d). (Round your answers to two decimal places.) quarter 1 forecast quarter 2 forecast quarter 3 forecast quarter 4 forecast (f) Is the model you developed in part (b) or the model you developed in part (d) more effective? Justify your answer. The model in part (b) appears to be more effective since there is no linear trend visible in the data. The model in part (d) appears to be more effective since it has more variables than the model in part (b). The model in part (b) appears to be more effective since it has a lower MSE than the model in part (d). The model in part (b) appears to be more effective since it has a higher MSE than the model in part (d). The model in part (d) appears to be more effective since it has a lower MSE than the model in part (b)
Step by Step Solution
There are 3 Steps involved in it

Get step-by-step solutions from verified subject matter experts