

Question: Consider the following time series data. Month 2 3 4 5 6 7 Value 23 13 19 14 19 23 16 a. Which of
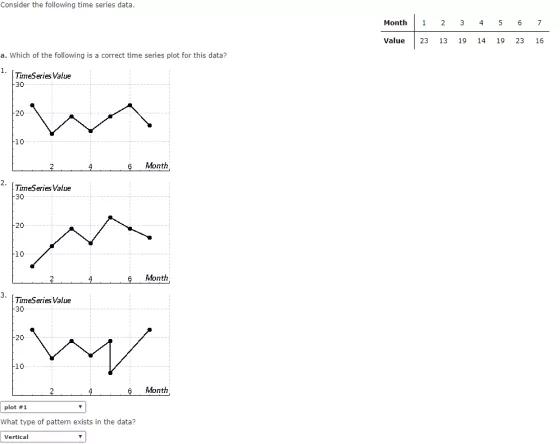
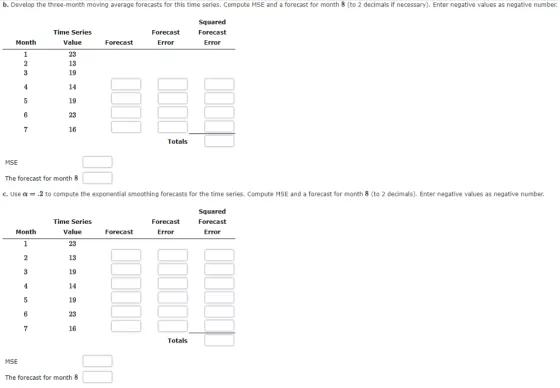
Consider the following time series data. Month 2 3 4 5 6 7 Value 23 13 19 14 19 23 16 a. Which of the following is a correct time series plot for this data? 1. TimeSeries Value 30 20 F10 Month 2. TimeSeries Value F30 F20 10 Month 3. TimeSeries Value 30 F20 10 Month plot What type of pattem exists in the data? Vertical b. Develog the three-month moving average forecasts for this time series. Compute MSE and a forecast for month 8 (to 2 decinals if necessary). Enter negative values as negative mumber. pauenbs Time Series Forecast Forecast Month Value Forecast Error Error 23 13 3 19 4. 14 19 23 16 Totals MSE The forecast for month e Use a=2 10 compute the esponantial amosthing forecasta for the time series. Computs HSE and a farecast for morth & (te 2 0ecimls). Enter negative vaies as negative number. parenbs Time Series Forecast Forecast Month Value Forecast Error Error 23 2 13 3 19 14 5 19 23 16 Totals MSE The forecast for month 8 00
Step by Step Solution
3.61 Rating (151 Votes )
There are 3 Steps involved in it
Time heliue ferecast Smaed Forecart Menth Frecast 23 2 13 19 4 2... View full answer

Get step-by-step solutions from verified subject matter experts