

Question: Consider the following time series data. Week 1 2 3 4 5 6 Value 19 12 16 11 18 13 (a) Construct a time series
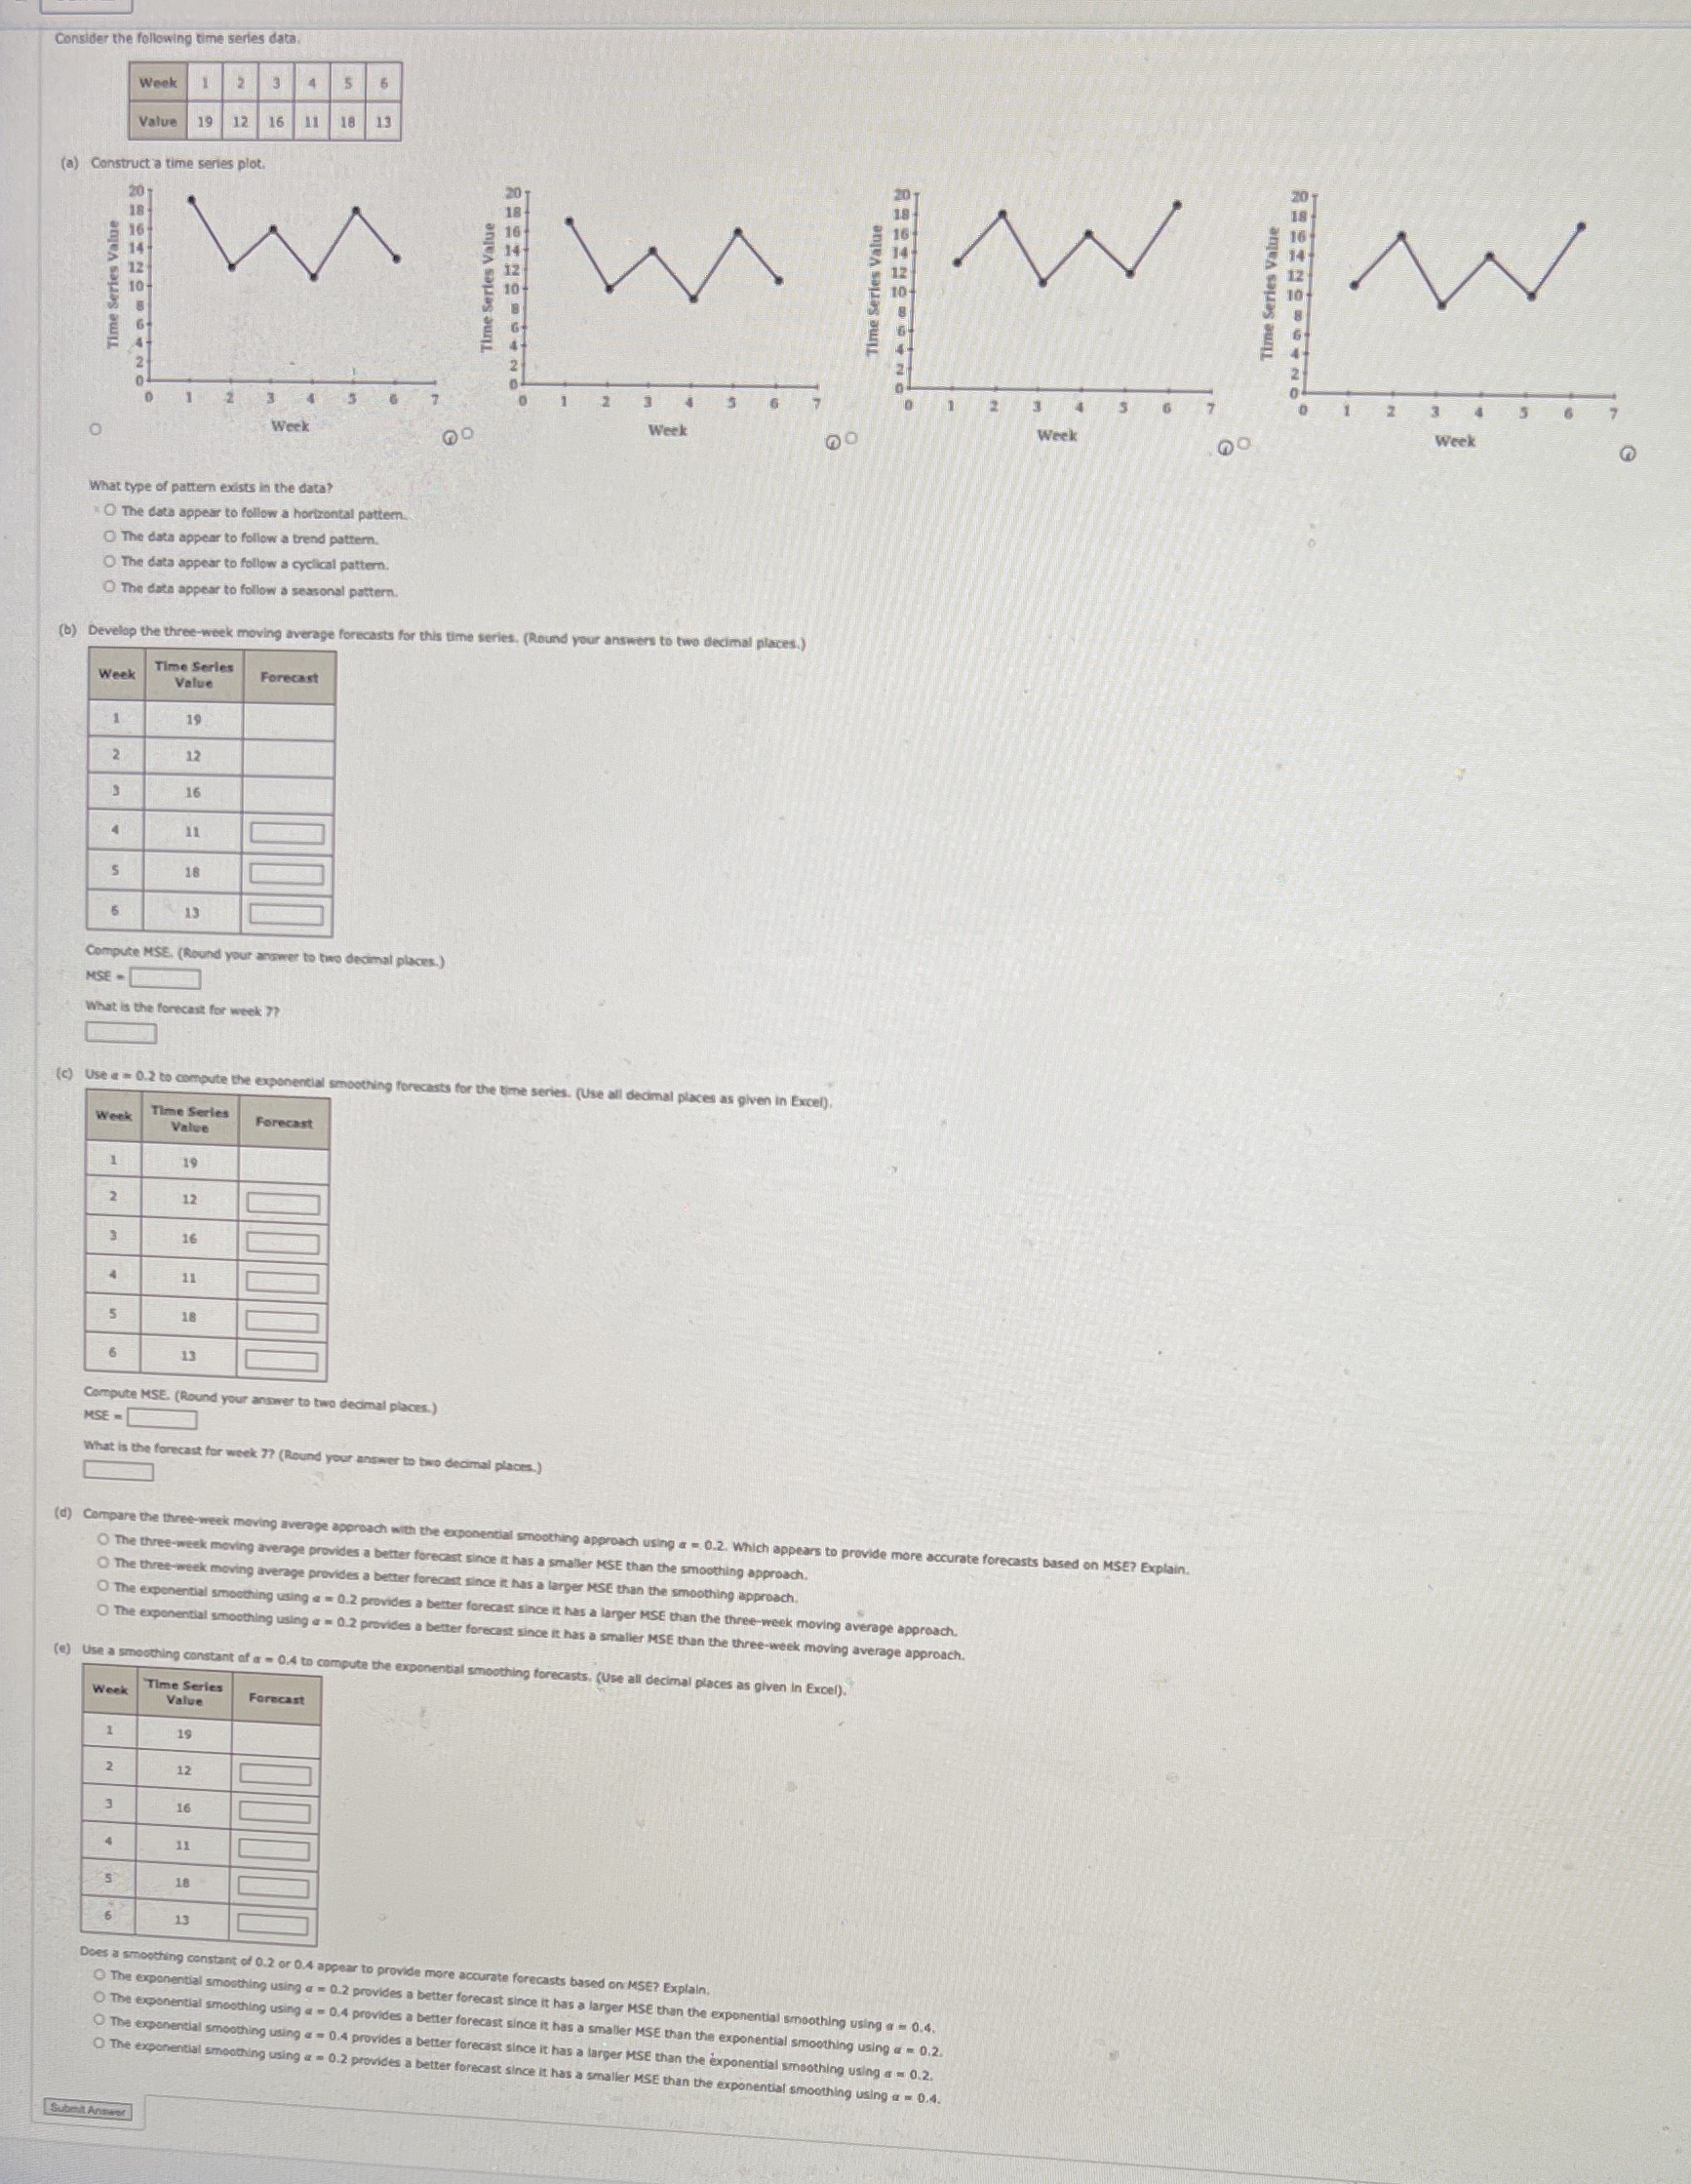
Consider the following time series data. Week 1 2 3 4 5 6 Value 19 12 16 11 18 13 (a) Construct a time series plot. 20 1 Time Series Value Time Series Value Time Series Value me Series Value 3 2 2 3 Week Week Week Week What type of pattern exists in the data? The data appear to follow a hor ontal pattern. The data appear to follow a trend pattern. The data ap The data app al pattern. (b) Develop the three-week ving average forecasts for this time series, (Round your answers Week Time Series Value Forecast 19 18 13 Compute MSE. (Round your answer to two decim MSE - What is the forecast for week ?? (C) Use a - 0.2 to compute the expone tries. (Use all decimal places as piven in Excel). Week Time Series Value Forecast 19 12 Compute MSE. (Rou d your answer to two decima What is the forecast for week 7? (Round your an (d) Compare the thre h using a =. 0.2. Which appears to provide more accurate forecasts based on MSE? Explain. The thre The three smoothing approach O The exp week moving average approach. moving average approach (e) Use a smo thing constant of a = 0.4 to c places as given in Excel). Week Time Series Value 16 Does a s at of 0.2 or 0.4 app The thing using O The expo al smoothing using a = 0.4. O The expo moothing using a = 0.2. The exp he exponential smoothing using a = 0.2. MSE than the exponential smoothing using a = 0.4. Submit
Step by Step Solution
There are 3 Steps involved in it

Get step-by-step solutions from verified subject matter experts