

Question: Consider the following time series data: Week Value 1 18 2 13 3 16 4 11 5 17 1) Construct a time series plot.
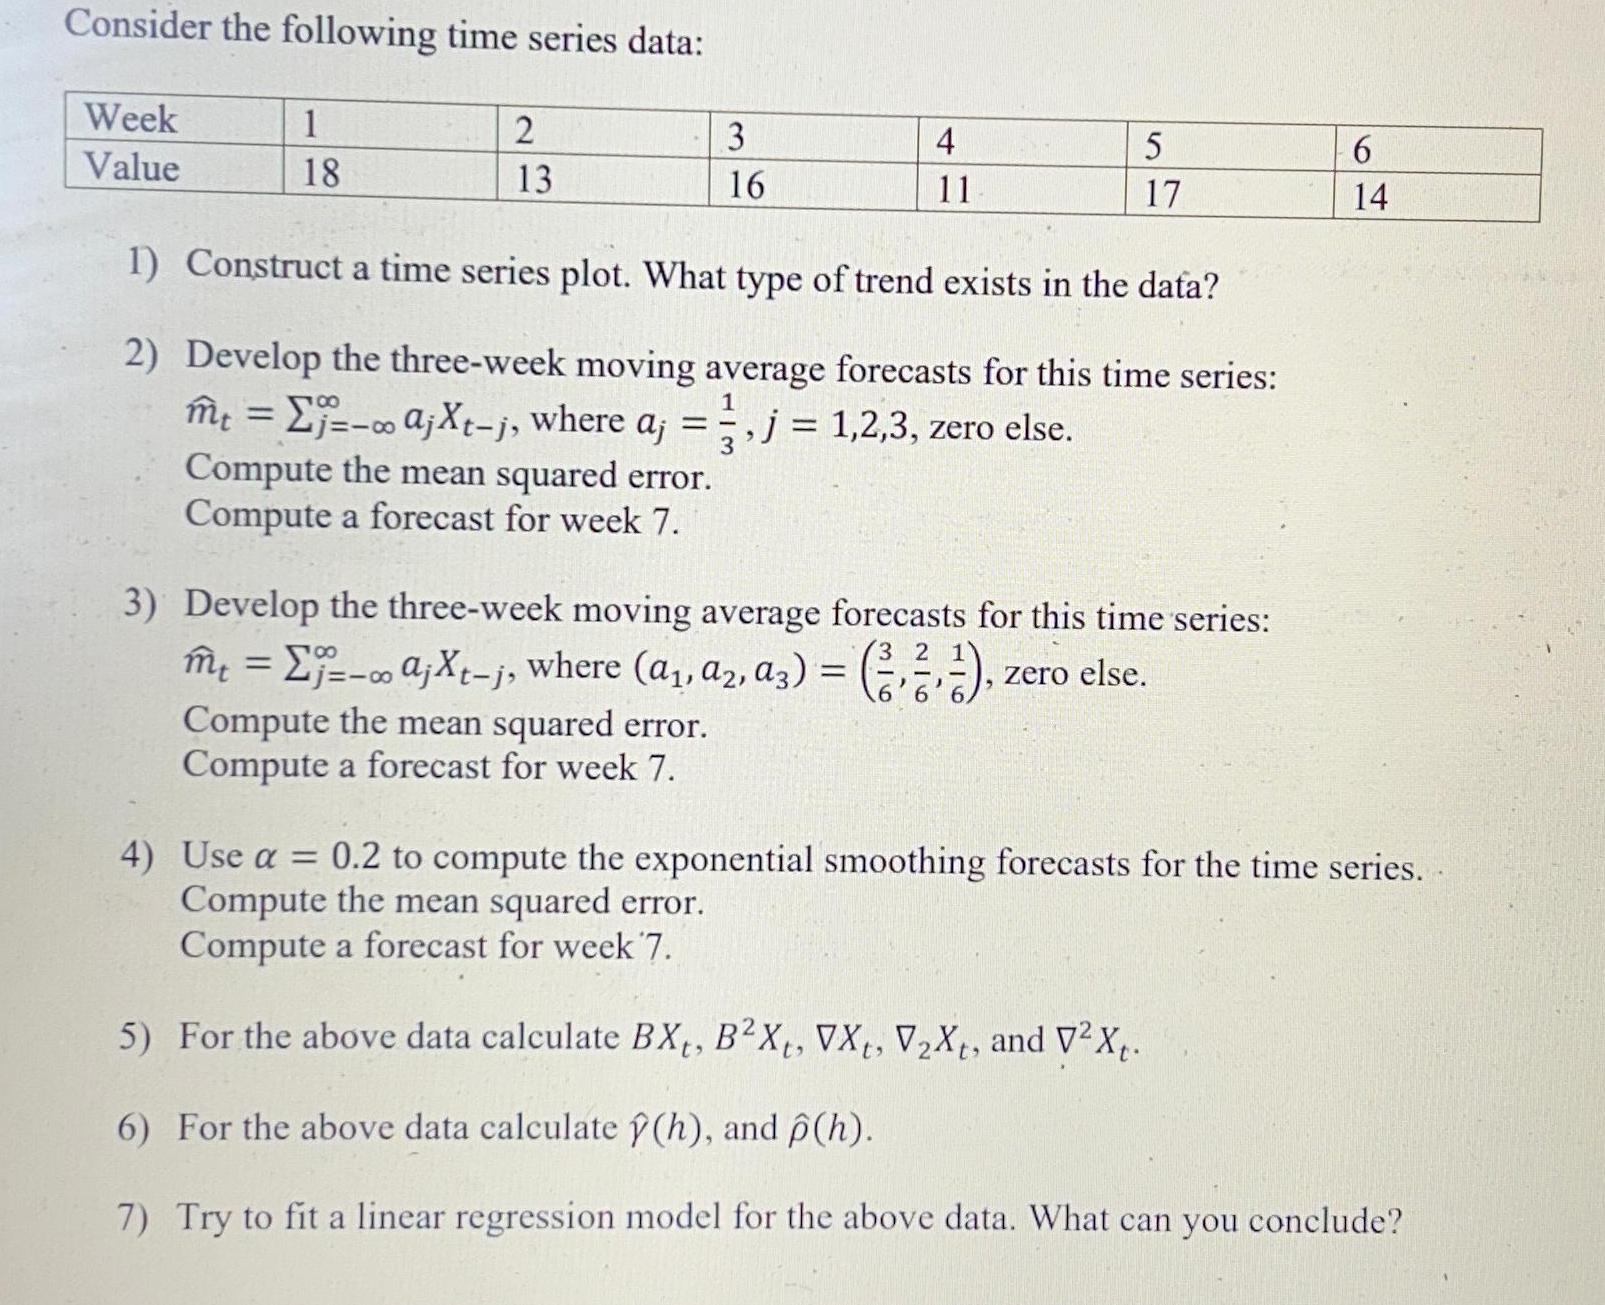
Consider the following time series data: Week Value 1 18 2 13 3 16 4 11 5 17 1) Construct a time series plot. What type of trend exists in the data? 2) Develop the three-week moving average forecasts for this time series: 1 mt = -- ajXt-j, where a;=, j = 1,2,3, zero else. 88 aj 3 Compute the mean squared error. Compute a forecast for week 7. 3) Develop the three-week moving average forecasts for this time series: m = ;=- Xt-j, where (a, a, a3) = (), zero else. Compute the mean squared error. Compute a forecast for week 7. 6 14 4) Use a = 0.2 to compute the exponential smoothing forecasts for the time series. Compute the mean squared error. Compute a forecast for week 7. 5) For the above data calculate BX, B2X, VX, VXt, and V2X. 6) For the above data calculate (h), and p(h). 7) Try to fit a linear regression model for the above data. What can you conclude?
Step by Step Solution
3.45 Rating (168 Votes )
There are 3 Steps involved in it
1 The time series plot shows a fluctuating trend with no clear increasing or decreasi... View full answer

Get step-by-step solutions from verified subject matter experts