

Question: Consider the following two 10-item data sets: Data Set A Data Set B 124, 126, 127, 129, 129, 130, 132, 132, 133, 136 12, 12,
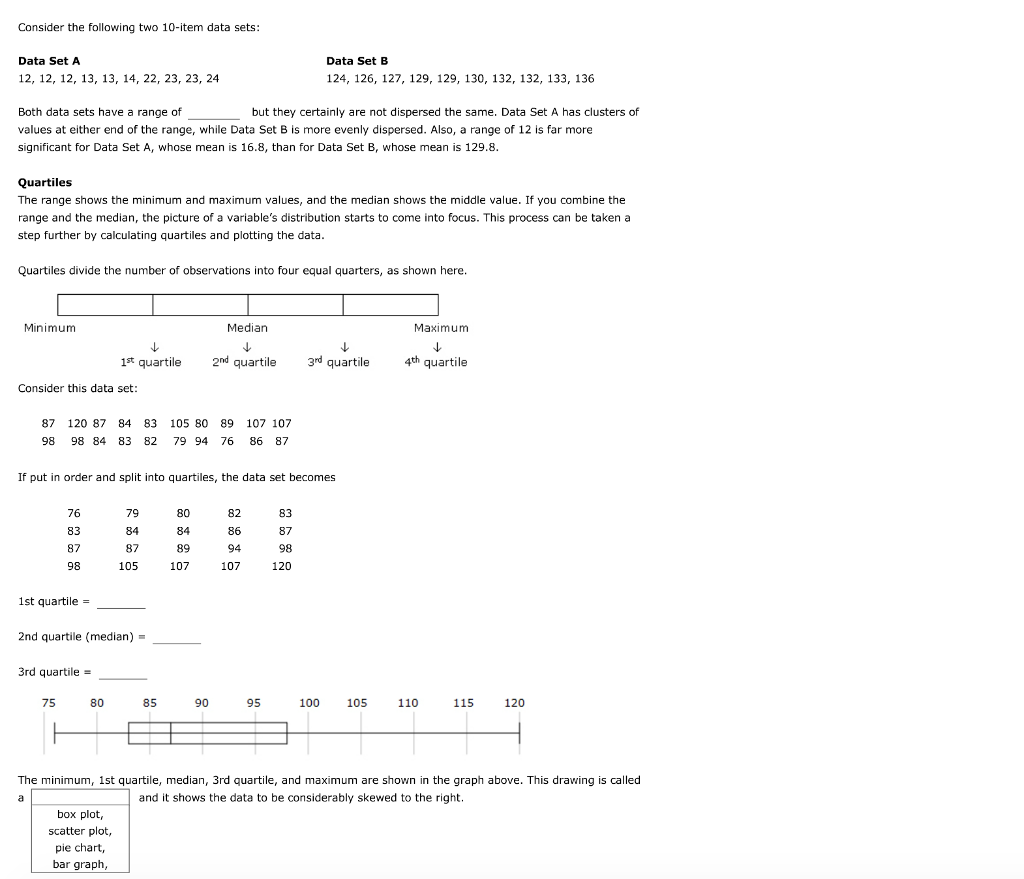
Consider the following two 10-item data sets: Data Set A Data Set B 124, 126, 127, 129, 129, 130, 132, 132, 133, 136 12, 12, 12, 13, 13, 14, 22, 23, 23, 24 but they certainly are not dispersed the same. Data Set A has clusters of Both data sets have a range of values at either end of the range, while Data Set B is more evenly dispersed. Also, a range of 12 is far more significant for Data Set A, whose mean is 16.8, than for Data Set B, whose mean is 129.8 Quartiles The range shows the minimum and maximum values, and the median shows the middle value. If you combine the range and the median, the picture of a variable's distribution starts to come into focus. This process can be taken a step further by calculating quartiles and plotting the data Quartiles divide the number of observations into four equal quarters, as shown here. Minimum Median Maximum 1st quartile 2nd quartile 3rd quartile 4th quartile Consider this data set 87 120 87 84 83 105 80 89 107 107 98 98 84 83 82 79 94 76 86 87 If put in order and split into quartiles, the data set becomes 76 79 84 87 105 80 84 89 107 82 86 94 107 83 87 98 120 87 98 1st quartile 2nd quartile (median) 3rd quartile 75 80 85 90 95 100 105 110 115 120 The minimum, 1st quartile, median, 3rd quartile, and maximum are shown in the graph above. This drawing is called and it shows the data to be considerably skewed to the right box plot, scatter plot, pie chart, bar graph
Step by Step Solution
There are 3 Steps involved in it

Get step-by-step solutions from verified subject matter experts