

Question: Consider the function g. g(I) = -3 For the x-values given in the table, determine the corresponding values of g(x) and plot each point on
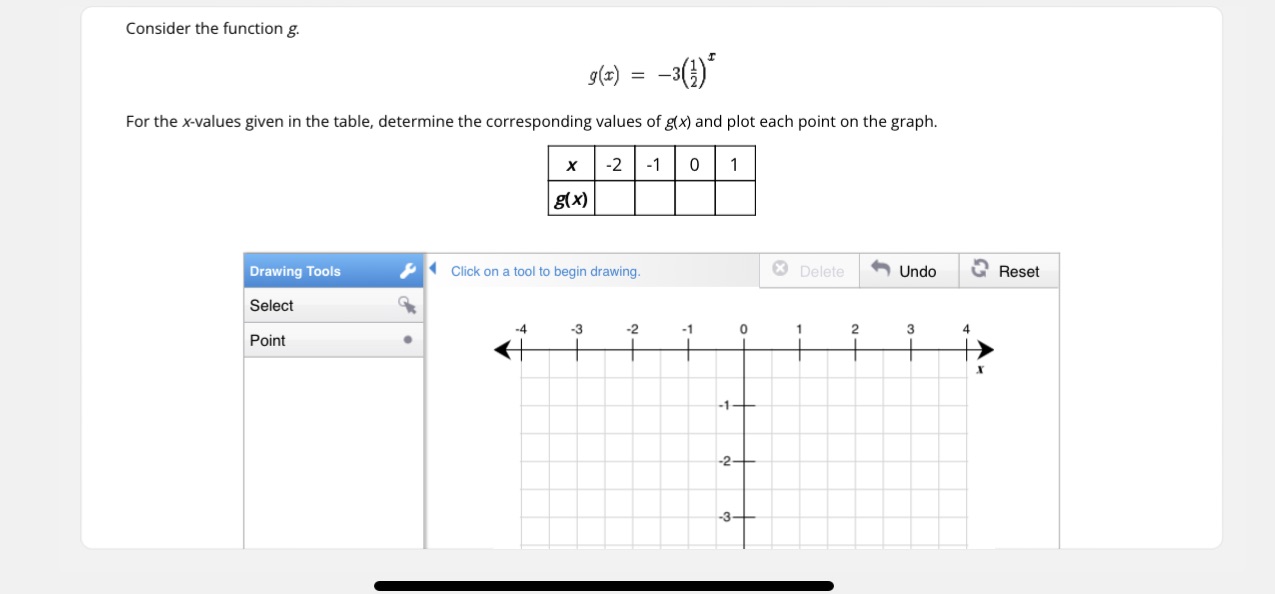
Consider the function g. g(I) = -3 For the x-values given in the table, determine the corresponding values of g(x) and plot each point on the graph. X -2 -1 0 g( X) Drawing Tools Click on a tool to begin drawing. Delete Undo Reset Select G Point 3 0 - N
Step by Step Solution
There are 3 Steps involved in it
1 Expert Approved Answer
Step: 1 Unlock

Question Has Been Solved by an Expert!
Get step-by-step solutions from verified subject matter experts
Step: 2 Unlock
Step: 3 Unlock