

Question: Consider the graph above. Determine the percent increase or decrease from June to July. Show your work. Round to the nearest hundredth. Write your answer
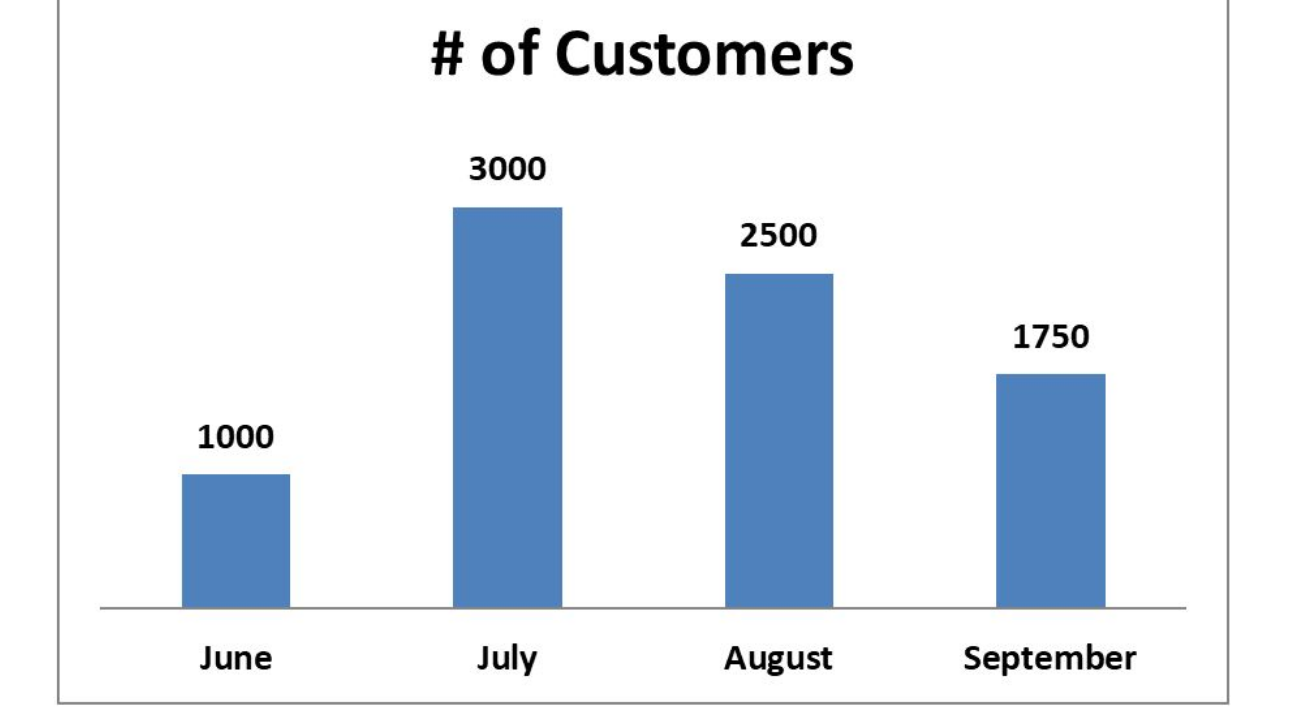
Consider the graph above. Determine the percent increase or decrease from June to July.
- Show your work.
- Round to the nearest hundredth.
- Write your answer as a complete sentence.
- Include the word "increase" or "decrease" in the answer.
# of Customers 3000 2500 1750 1000 June July August September
Step by Step Solution
There are 3 Steps involved in it
1 Expert Approved Answer
Step: 1 Unlock

Question Has Been Solved by an Expert!
Get step-by-step solutions from verified subject matter experts
Step: 2 Unlock
Step: 3 Unlock