

Question: Consider the graph below, and assume the CAPM and SML are valid. What is the MRP? 15% 6% 9% 3% 12% E(R) .18 .17 .16
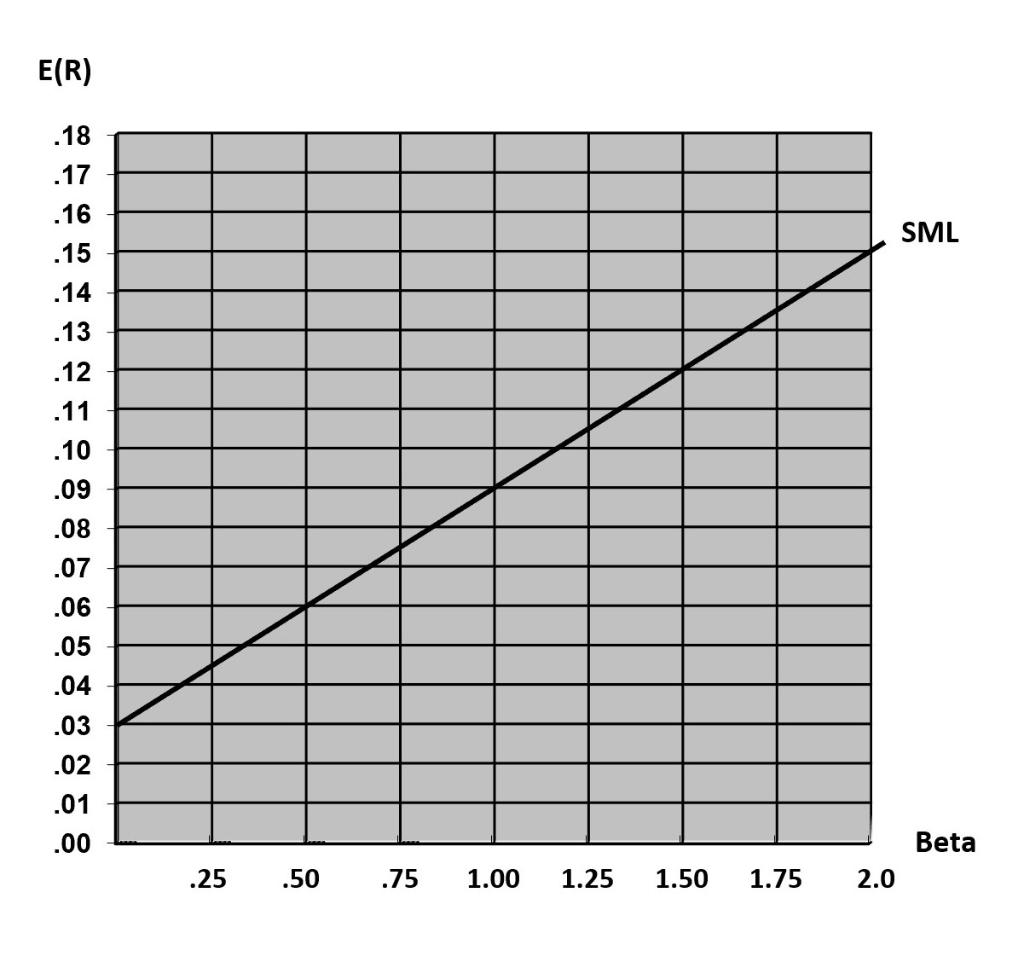 Consider the graph below, and assume the CAPM and SML are valid. What is the MRP?
15%
6%
9%
3%
12%
E(R) .18 .17 .16 SML .15 .14 .13 .12 .11 .10 .09 .08 .07 .06 .05 .04 .03 .02 .01 .00 Beta .25 .50 .75 1.00 1.25 1.50 1.75 2.0
Step by Step Solution
There are 3 Steps involved in it
1 Expert Approved Answer
Step: 1 Unlock

Question Has Been Solved by an Expert!
Get step-by-step solutions from verified subject matter experts
Step: 2 Unlock
Step: 3 Unlock