

Question: Consider the graph below (Fig. 1-2 from Robert Gordon's book The Rise and Fall of American Growth ). The y-axis shows average growth rates in
Consider the graph below (Fig. 1-2 from Robert Gordon's book The Rise and Fall of American Growth). The y-axis shows average growth rates in U.S. labor productivity, measured as output per hour, in three time periods. Each bar shows the contributions of improvements in education, capital deepening, and growth in total factor productivity (TFP) to this growth in labor productivity.
Labor productivity growth was almost twice as high during the 1920-1970 period, compared to the periods before and after shown. Based on the graph, which component of labor productivity growth is most responsible for this difference?
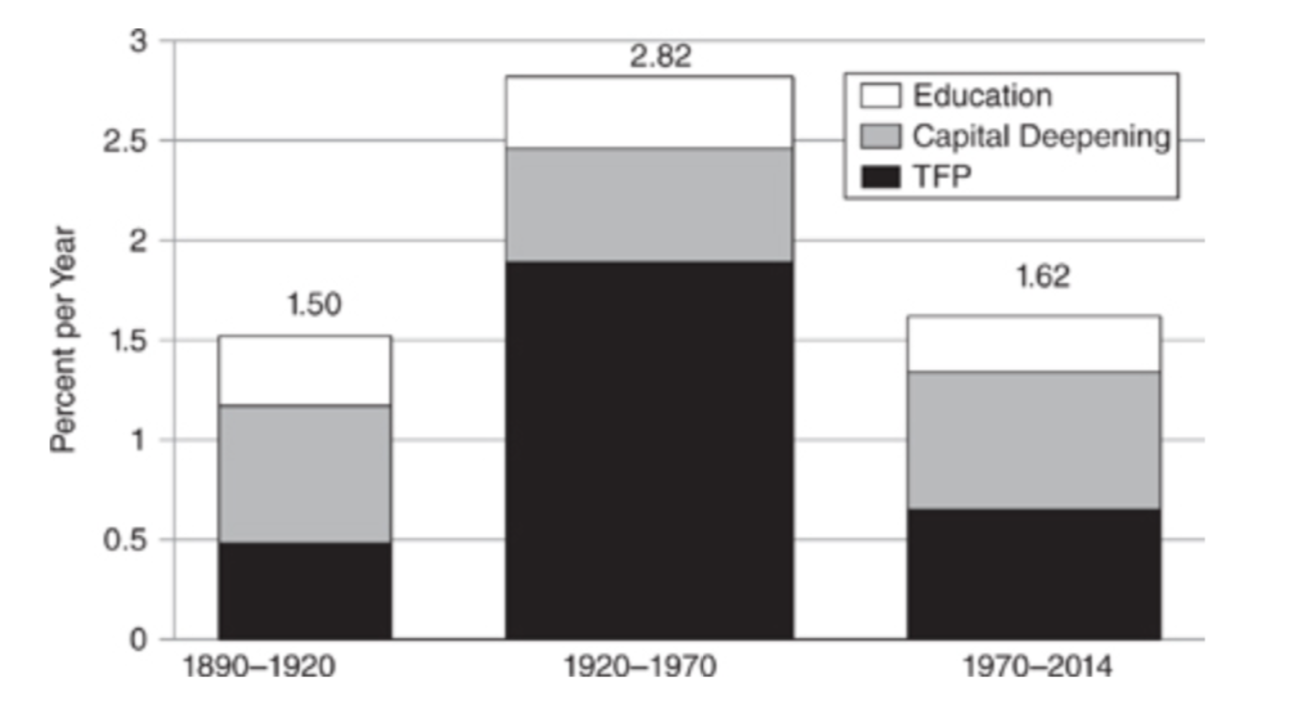
2.82 Education 2.5 Capital Deepening TFP 2 1.62 1.50 Percent per Year 1.5 0.5 0 1890-1920 1920-1970 1970-2014
Step by Step Solution
There are 3 Steps involved in it

Get step-by-step solutions from verified subject matter experts