

Question: Consider the graph below related to the EOQ ( Hint: though note labeled, the various lines represent ( 1 ) ordering costs, ( 2 )
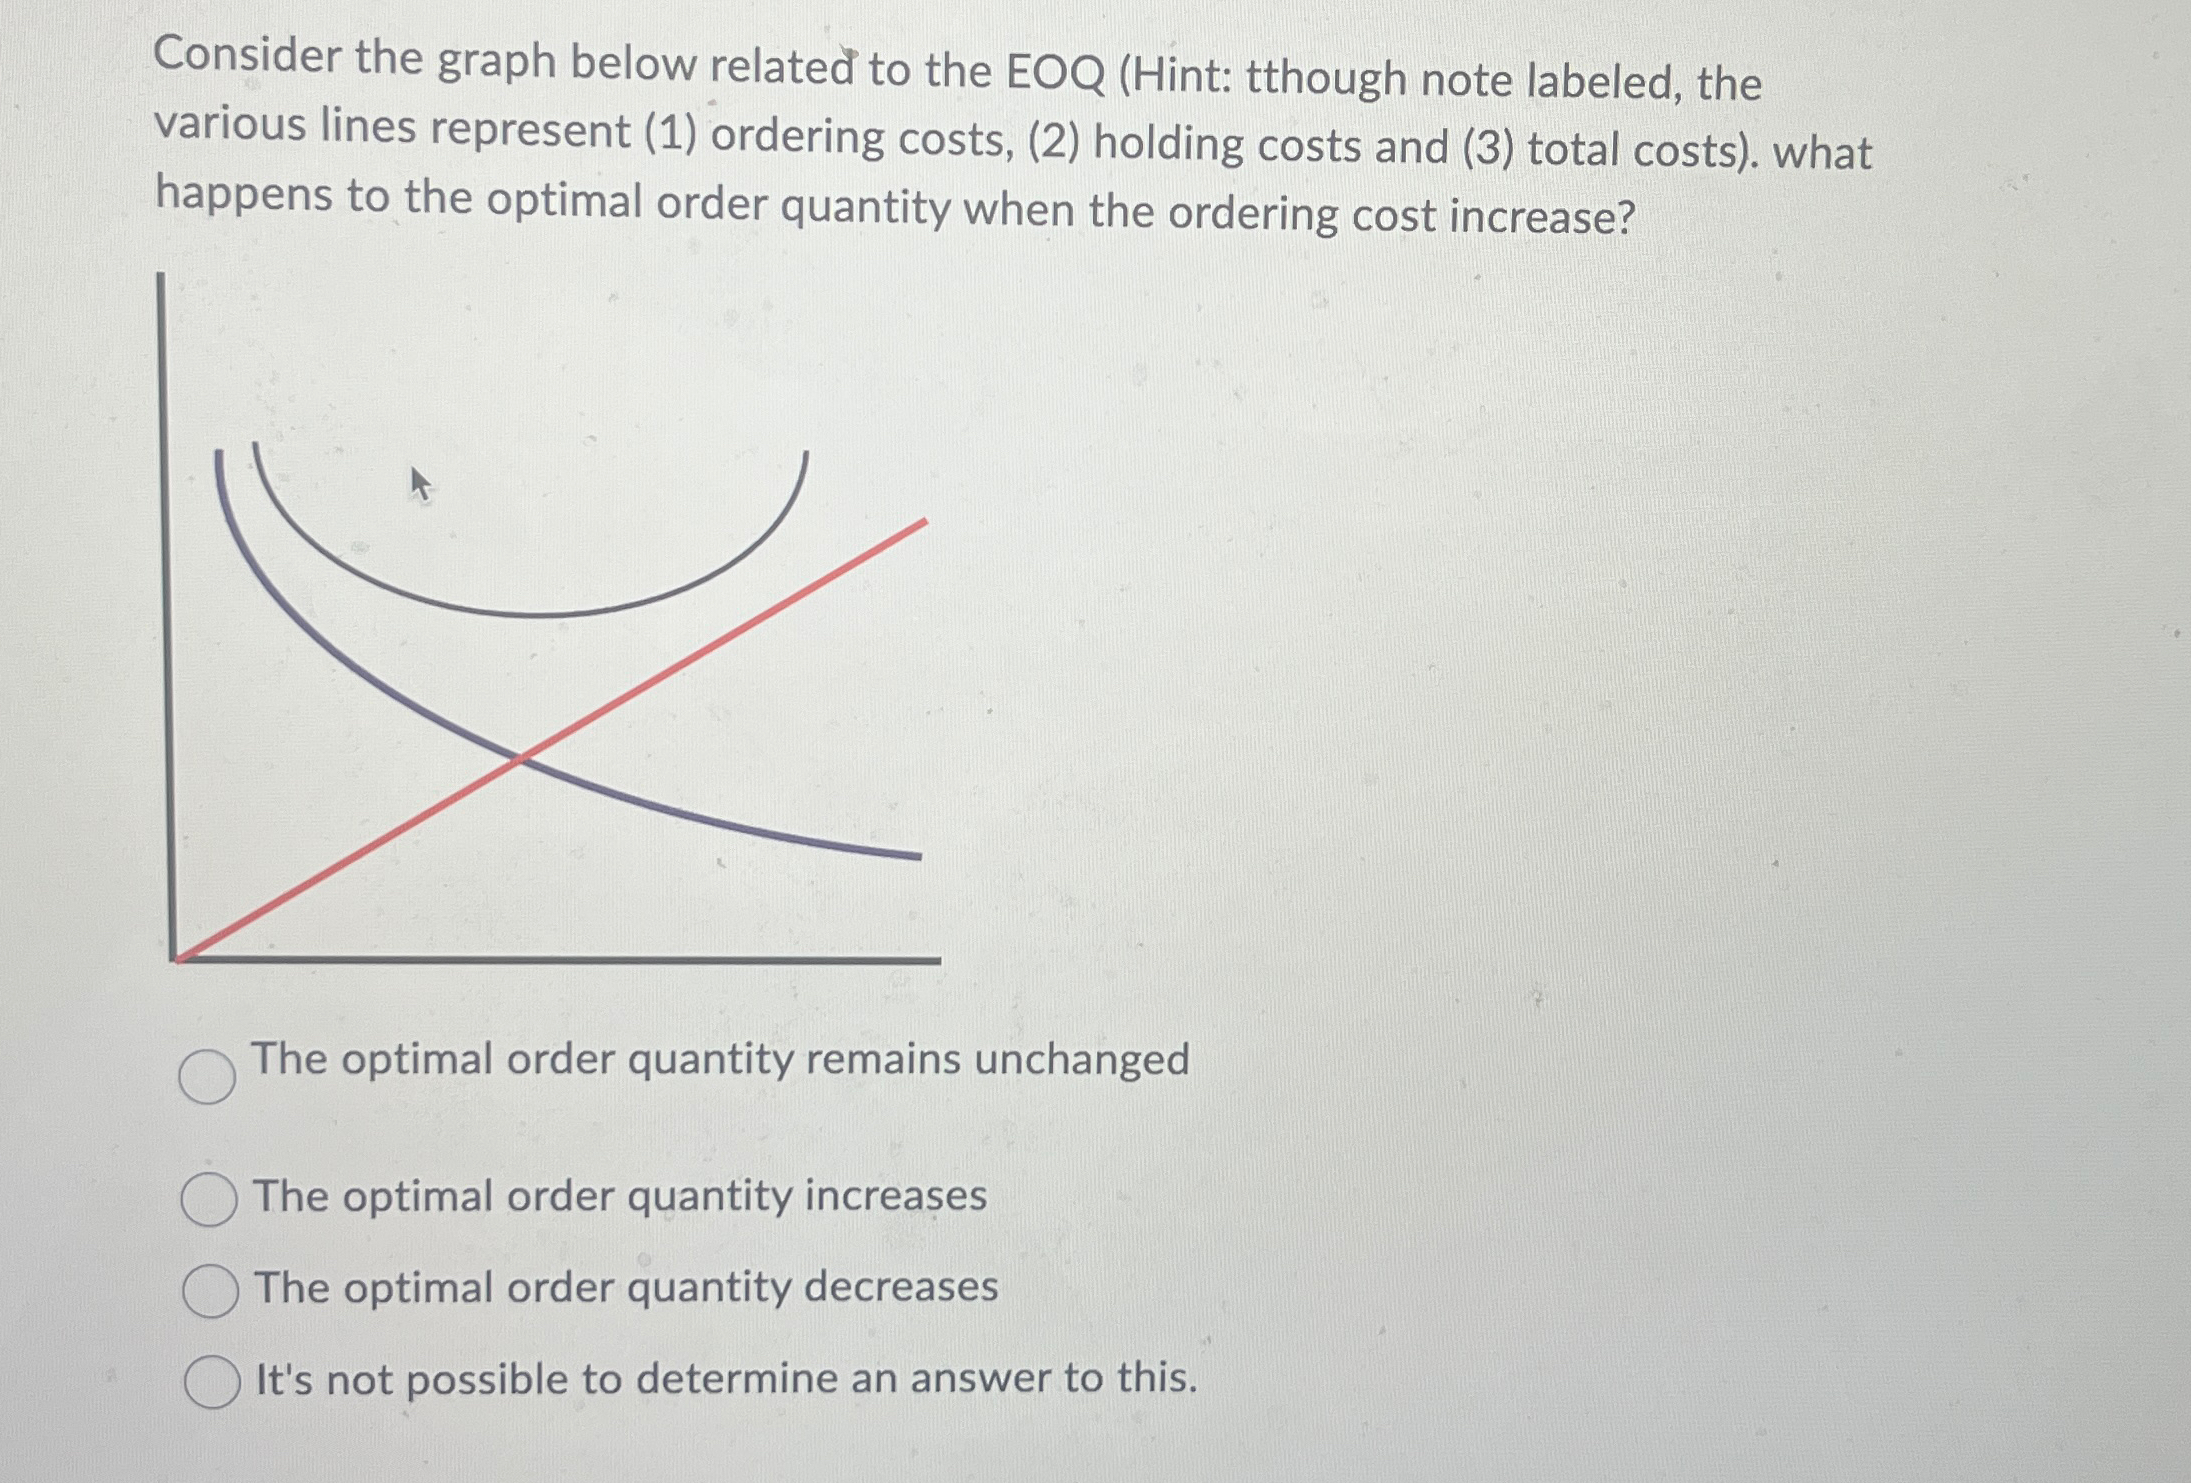
Consider the graph below related to the EOQ Hint: though note labeled, the various lines represent ordering costs, holding costs and total costs what happens to the optimal order quantity when the ordering cost increase?
The optimal order quantity remains unchanged
The optimal order quantity increases
The optimal order quantity decreases
It's not possible to determine an answer to this.
Step by Step Solution
There are 3 Steps involved in it
1 Expert Approved Answer
Step: 1 Unlock

Question Has Been Solved by an Expert!
Get step-by-step solutions from verified subject matter experts
Step: 2 Unlock
Step: 3 Unlock