

Question: Consider the graphs in Example 1, Exercise 1 and exercise 2 and respond the request below; a. What trend do you see with recycling in
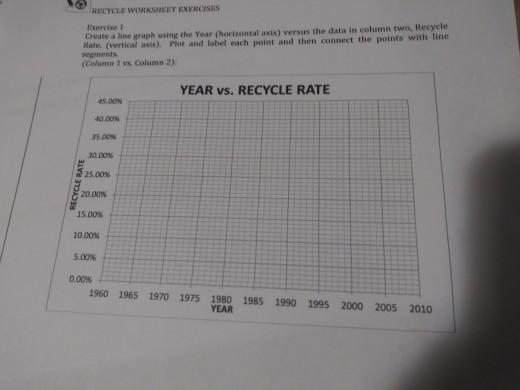
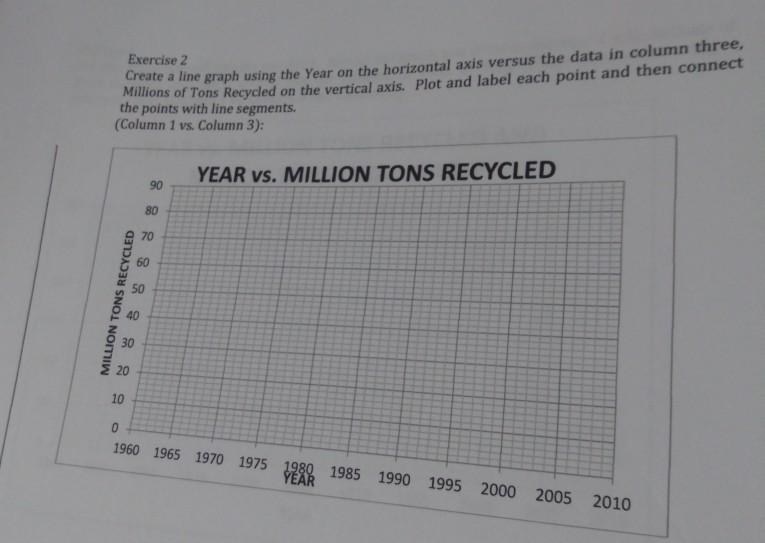
Consider the graphs in Example 1, Exercise 1 and exercise 2 and respond the request below; a. What trend do you see with recycling in the US over the last 40 years? b. Do you feel this increase is acceptable or do you feel we should recycle more?
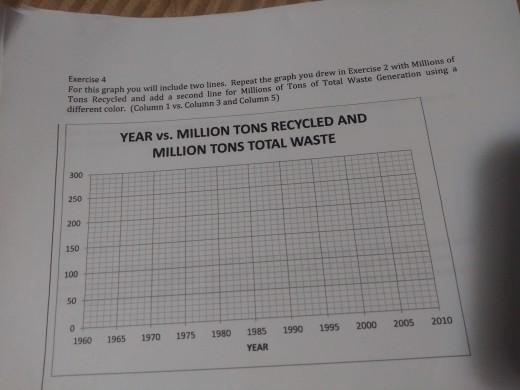
Consider the gap between the 2 lines of the graph from exercise 4 above. explain what this gap represents and then explain your interpretation pf whay this signifies.
b. More recent data from 2017, according to the Environmental Protection Agency indicates that the average person produces 4.51 pound of waste each day. Compare this to the data from the year 2007 in the table above. What does this tell you about the progress that is being made with regards to individual production of waste?
c. Hoe does the Generation Tonnage in the year 2017 compare to the Tonnage in the year 2007 from the table above(column #4)?
d. Each ton of waste occupies approximately 4 cubic yards of space . (to visualize 1 cubic yard, think of a box thay is 3 feet long, 3 feet wide and 3 feet tall). If the year 2007 produces 275,000,000 tons of waste, how many cubic yard were needed to dispose of that waste?
e. If one cubic year is equal to 27 cubic feet, approximately how many times can you fill the Houston Astrodome if you have 275,000,000 tons of waste?
RECYCLE WORKSHEET KERCISES Dreate a negraph using the Year (horisontal axis) versus the data in column twe, Recycle Hans (vertical axis) Poe and tabel each point and then connect the points with line ents ( Cus Calumu 2) YEAR VS. RECYCLE RATE ON S.OON 30.00 25.00 RECYCLE RATE 20.00 15.00 10.00 5.00 0.00 1960 1965 1970 1975 1980 1989 1990 1995 2000 2005 2010 YEAR Exercise 2 Create a line graph using the Year on the horizontal axis versus the data in column three, Millions of Tons Recycled on the vertical axis. Plot and label each point and then connect the points with line segments. (Column 1 vs. Column 3): YEAR VS. MILLION TONS RECYCLED 90 80 70 60 50 MILLION TONS RECYCLED 40 30 20 10 0 1960 1965 1970 1975 1980 1985 YEAR 1990 1995 2000 2005 2010 Exercise 4 For this graph you will include two times. Repeat the graph you drew in Exercise 2 with Millions of different color. (Column 1 vs. Column 3 and Column 5) Tons Recycled and add a second line for Millions of Tons of Total Waste Generation using YEAR VS. MILLION TONS RECYCLED AND MILLION TONS TOTAL WASTE 300 250 200 150 100 50 2005 2010 2000 1995 1990 1980 1975 1960 1965 1970 1985 YEAR RECYCLE WORKSHEET KERCISES Dreate a negraph using the Year (horisontal axis) versus the data in column twe, Recycle Hans (vertical axis) Poe and tabel each point and then connect the points with line ents ( Cus Calumu 2) YEAR VS. RECYCLE RATE ON S.OON 30.00 25.00 RECYCLE RATE 20.00 15.00 10.00 5.00 0.00 1960 1965 1970 1975 1980 1989 1990 1995 2000 2005 2010 YEAR Exercise 2 Create a line graph using the Year on the horizontal axis versus the data in column three, Millions of Tons Recycled on the vertical axis. Plot and label each point and then connect the points with line segments. (Column 1 vs. Column 3): YEAR VS. MILLION TONS RECYCLED 90 80 70 60 50 MILLION TONS RECYCLED 40 30 20 10 0 1960 1965 1970 1975 1980 1985 YEAR 1990 1995 2000 2005 2010 Exercise 4 For this graph you will include two times. Repeat the graph you drew in Exercise 2 with Millions of different color. (Column 1 vs. Column 3 and Column 5) Tons Recycled and add a second line for Millions of Tons of Total Waste Generation using YEAR VS. MILLION TONS RECYCLED AND MILLION TONS TOTAL WASTE 300 250 200 150 100 50 2005 2010 2000 1995 1990 1980 1975 1960 1965 1970 1985 YEAR
Step by Step Solution
There are 3 Steps involved in it

Get step-by-step solutions from verified subject matter experts