

Question: Prepare a graph to shows your order point determination. Item Total demand Ordering cost Carrying cost Delivery time stock Safety stock EOQ No of orders
Prepare a graph to shows your order point determination. 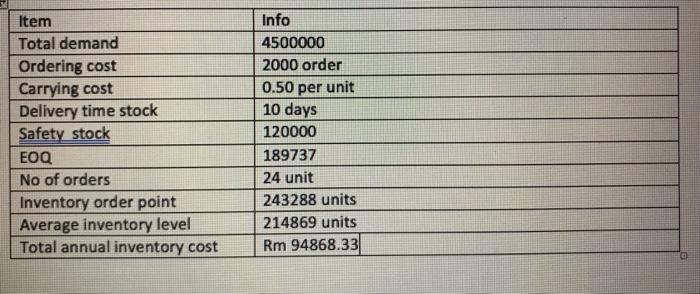
Item Total demand Ordering cost Carrying cost Delivery time stock Safety stock EOQ No of orders Inventory order point Average inventory level Total annual inventory cost Info 4500000 2000 order 0.50 per unit 10 days 120000 189737 24 unit 243288 units 214869 units Rm 94868.33
Step by Step Solution
There are 3 Steps involved in it
1 Expert Approved Answer
Step: 1 Unlock

Question Has Been Solved by an Expert!
Get step-by-step solutions from verified subject matter experts
Step: 2 Unlock
Step: 3 Unlock