

Question: Consider the hypothesis test below. H0 1P1 P2 S 0 Ha :P1 _P2 > 0 The following results are for independent samples taken from the

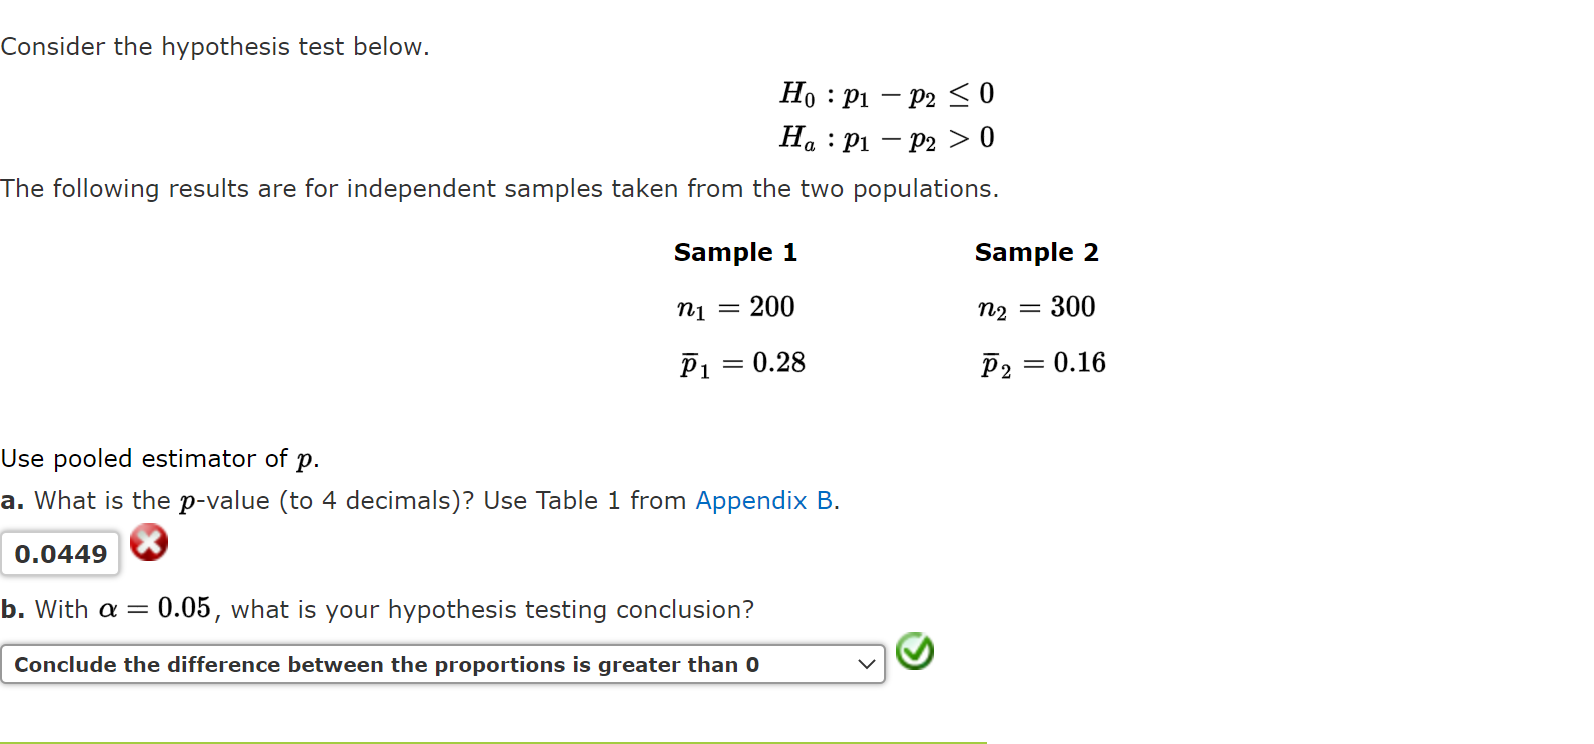
Consider the hypothesis test below. H0 1P1 P2 S 0 Ha :P1 _P2 > 0 The following results are for independent samples taken from the two populations. Sample 1 Sample 2 m = 200 n; = 300 131 = 0.28 132 = 0.16 Use pooled estimator of p. a. What is the p-value (to 4 decimals)? Use Table 1 from Appendix B. 0.0449 0 b. With a = 0.05, what is your hypothesis testing conclusion? Conclude the difference between the proportions is greater than 0 V 9
Step by Step Solution
There are 3 Steps involved in it
1 Expert Approved Answer
Step: 1 Unlock

Question Has Been Solved by an Expert!
Get step-by-step solutions from verified subject matter experts
Step: 2 Unlock
Step: 3 Unlock