

Question: Consider the information in the table below: Stock Expected Return Beta Standard Deviation Stock A 11% 1.5 18% Stock B 10% 2.5 20% Stock C
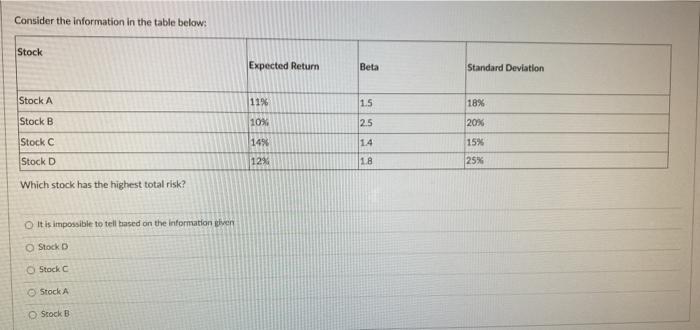
Consider the information in the table below: Stock Expected Return Beta Standard Deviation Stock A 11% 1.5 18% Stock B 10% 2.5 20% Stock C 149 14 15% 25% Stock D 1294 18 Which stock has the highest total risk? It is impossible to tell based on the information given Stock Stock Stock A Stock B
Step by Step Solution
There are 3 Steps involved in it
1 Expert Approved Answer
Step: 1 Unlock

Question Has Been Solved by an Expert!
Get step-by-step solutions from verified subject matter experts
Step: 2 Unlock
Step: 3 Unlock