

Question: Consider the loan processing cycle time data below. Set up an EWMA control chart for monitoring this process using with 1 = 0.1 and L
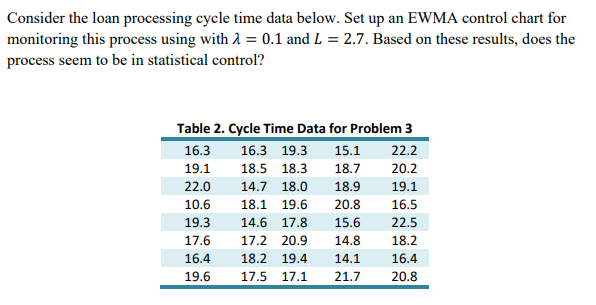
Consider the loan processing cycle time data below. Set up an EWMA control chart for monitoring this process using with 1 = 0.1 and L = 2.7. Based on these results, does the process seem to be in statistical control? Table 2. Cycle Time Data for Problem 3 16.3 16.3 19.3 15.1 22.2 19.1 18.5 18.3 18.7 20.2 22.0 14.7 18.0 18.9 19.1 10.6 18.1 19.6 20.8 16.5 19.3 14.6 17.8 15.6 22.5 17.6 17.2 20.9 14.8 18.2 16.4 18.2 19.4 14.1 16.4 19.6 17.5 17.1 21.7 20.8
Step by Step Solution
There are 3 Steps involved in it
1 Expert Approved Answer
Step: 1 Unlock

Question Has Been Solved by an Expert!
Get step-by-step solutions from verified subject matter experts
Step: 2 Unlock
Step: 3 Unlock